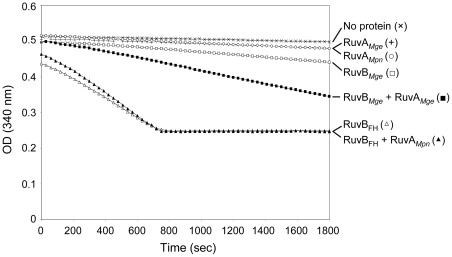
Figure 7. The influence of RuvAMpn and RuvAMge on the ATPase activities of RuvBFH and RuvBMge, respectively.
ATP hydrolysis by RuvBFH and RuvBMge was measured at a protein concentration of 0.5 µM, either in the absence of presence of the corresponding RuvA protein (at 1 µM). The ATPase activity was determined using an NADH-coupled assay. In this assay, the activity is calculated from the stationary velocities of ATP hydrolysis, as determined by monitoring the absorption of NADH at 340 nm [15], [46]. The ‘no protein’ reaction (×) indicates a control reaction performed in the absence of any protein. (+), RuvAMge alone; (○), RuvAMpn alone; (□), RuvBMge alone; (▪), RuvBMge plus RuvAMge; (▵), RuvBFH alone; (▴), RuvBFH plus RuvAMpn. The graph shows a representative experiment.

