Figure 2.
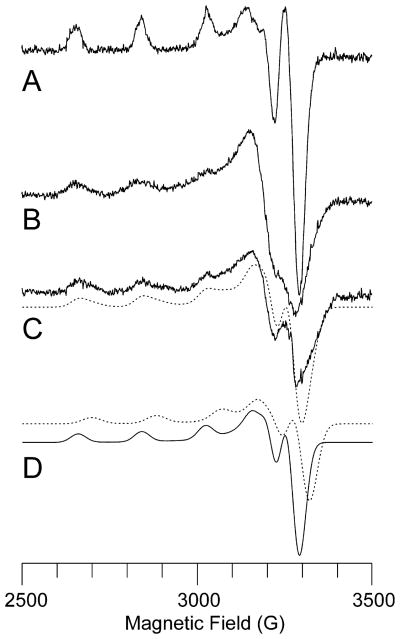
X-band EPR spectra of Methylocystis sp. strain M pMMO. (A) Cu-EDTA standard (250 μM). (B) Membrane-bound pMMO. (C) Solubilized pMMO with simulation (dashed line) generated by summing two contributing type 2 CuII centers. (D) Individual simulated spectra of the two components in (C). The experimental spectra are offset for clarity, but their intensities are meaningful since the spectra were recorded under identical conditions. Experimental parameters: microwave frequency, 9.21 GHz; microwave power, 15 dB; modulation amplitude, 5.000 G; receiver gain, 1.25 × 10²; time constant, 0.3 s; temperature, 77 K; 2 min scan. Simulation parameters for major component (solid line in part D): relative integrated intensity, 1.0; g⊥ = 2.052, g|| = 2.247, A(63Cu)|| = 570 MHz, A (63Cu)⊥ = 60 MHz. Simulation parameters for minor component (dashed line in part D): relative integrated intensity, 0.7; g⊥ = 2.04, g|| = 2.215, A(63Cu)|| = 570 MHz, A(63Cu)⊥ = 60 MHz.

