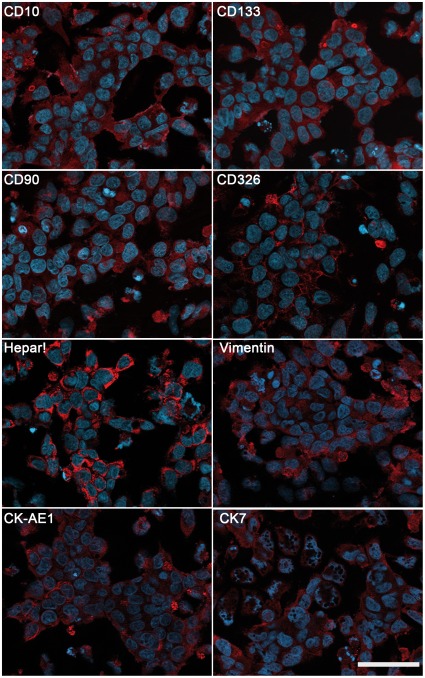
Figure 4. Expression of tumour-related proteins in HC-AFW1.
Images show immunofluorescence staining of cultured cells. Red fluorescence denotes homogenous expression of CD90, CD326, cytokeratin type 1 (CK AE1) and HepPar1 as well as heterogeneous distribution of CD10, CD133, Vimentin and Cytokeratin 7 (CK7) within the cells. Blue fluorescence indicates nuclei (DAPI staining). Bars represent 50 µm.

