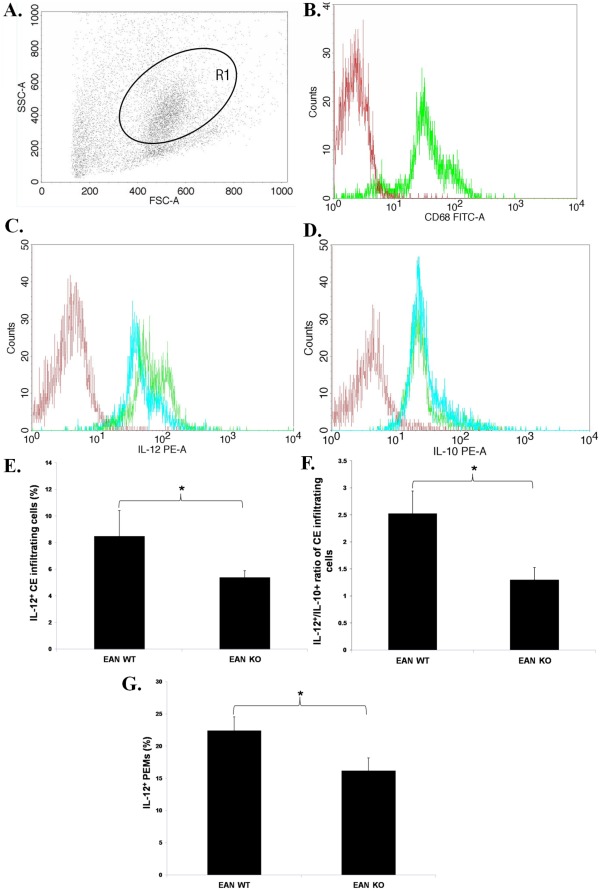
Figure 2. Expression of IL-12 in the CE infiltrating cell and in non-stimulated PEMs of TNF-α KO EAN mice.
A. EAN mice were sacrificed at nadir of disease (day 28 p.i.) and CE infiltrating cells were analyzed by flow cytometry. Generic features of CE infiltrating cells in EAN, as assessed by light scatter properties (FSC and SSC) in flow cytometry, are shown. B. R1 represents macrophage (macrosialin+) subpopulation (The red histogram denotes the staining with FITC-conjugated isotype antibody and the green one denotes the staining with anti-CD68 (macrosialin) antibody (Clone: ED1)). C. Representative flow cytometric data show that CE infiltrating cells of TNF-α KO mice expressed lower levels of IL-12 (blue histogram) than those of WT mice (green). The histogram in red denotes the staining with PE-conjugated isotype antibody. D. Representative flow cytometric data indicate similar expressions of IL-10 by CE infiltrating cells of TNF-α KO mice (blue histogram) and of WT mice (green). The red histogram denotes the staining with PE-conjugated isotype antibody. E. CE infiltrating cells of TNF-α KO mice expressed significantly lower IL-12 levels than those of WT mice. F. The ratio of the expressing cells of IL-12 to IL-10 was significantly lower in CE infiltrating cells from TNF-α KO mice than from WT mice. G. At the peak of EAN (day 28 p.i.), non-stimulated PEMs were collected by standard lavage of peritoneal cavity and the expression of IL-12 was detected by flow cytometry. TNF-α deficient PEMs expressed significantly lower levels of IL-12 compared with their WT counterparts. Data are presented as mean value ± SD of one representative out of two independent experiments (n = 5 or 6 in each group). * p<0.05.

