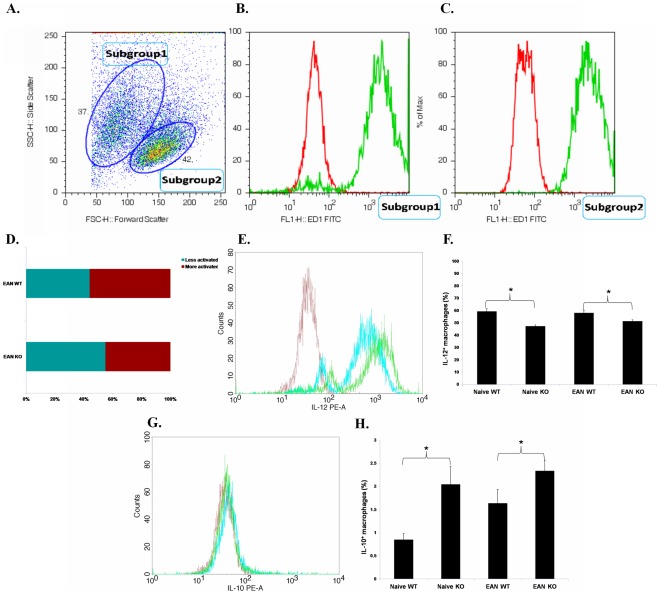
Figure 3. Expression of IL-12 and IL-10 in stimulated macrophages.
Thioglycollate elicited macrophages were harvested by standard lavage of peritoneal exudates with 10 ml serum-free culture medium DMEM/F12, cultivated and stimulated with LPS plus IFN-γ for 24 h. A. Macrophages were assessed by flow cytometry. In both naïve and EAN mice, two subgroups of PEMs were presented. The right group of cells with larger size (Subgroup 2) expressed higher levels of IL-6 and IL-12 (data not shown), compared with Subgroup 1, indicating a stronger activation of these cells. B. and C. Cells in both groups expressed macrosialin (The red histograms denote the stainings of controls with FITC-conjugated isotype antibody and the greens denote the stainings with anti-macrosialin antibody (Clone: ED1)). D. In EAN, the proportion of more activated PEMs was significantly lower in TNF-α KO mice than in WT mice (p<0.05). E. Representative flow cytometric data show that after proinflammatory stimulation, macrophages from TNF-α KO mice with EAN (blue histogram) expressed lower levels of IL-12 than from WT mice with EAN (green). The red histogram denotes the staining with PE-conjugated isotype antibody. F. After proinflammatory stimulation, the proportion of IL-12+ macrophages was significantly lower in TNF-α KO mice than in WT mice (both naive and EAN). G. Representative flow cytometric data show that after proinflammatory stimulation, macrophages from TNF-α KO mice with EAN (blue histogram) expressed higher levels of IL-12 than from WT mice with EAN (green). The red histogram denotes the staining with PE-conjugated isotype antibody. H. After proinflammatory stimulation, the proportion of IL-10+ macrophages was significantly higher in TNF-α KO mice than in WT mice, independent of EAN induction. Data are presented as mean value ± SD of one representative out of three independent experiments (n = 5 or 6 in each group). * p<0.05.

