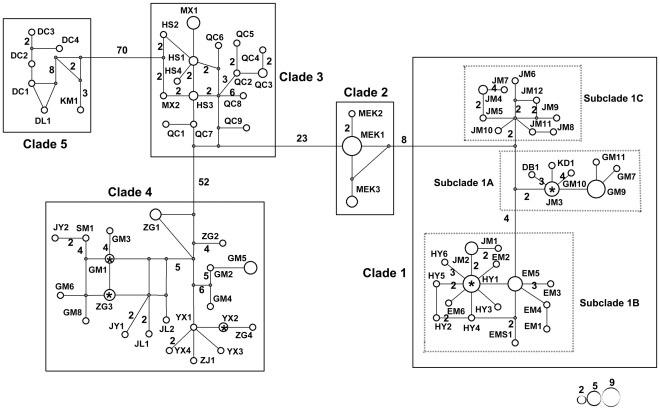
Figure 3. Median-joining network of all cyt b haplotypes found in Apodemus draco.
The missing haplotypes in the network are represented by gray dots. Circle sizes are proportional to the number of individuals sharing the same haplotypes. Each mutation step is shown as a short line connecting neighboring haplotypes, and numbers of mutations between haplotypes are indicated near branches if it is greater than one. Haplotype designations can be found in Table 1. Evolutionary clades correspond to the five major clades and three subclades in Fig. 2. Haplotypes from different populations are marked as *.

