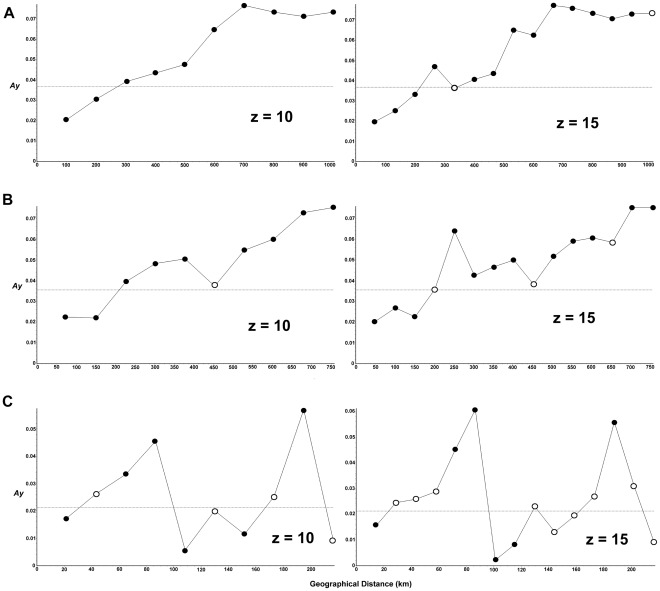
Figure 4. Results of spatial autocorrelation analyses of cyt b sequences in Apodemus draco.
Analyses were performed using different distance classes (5, 10 and 15). Only the results of z = 10 and 15 distance classes were shown. Black circles represent values significantly different (p<0.05) from the mean Ay. (a) All individuals. (b) Exclude all the GenBank sequences due to we did not have their coordinates. (c) Individuals in clade 1.

