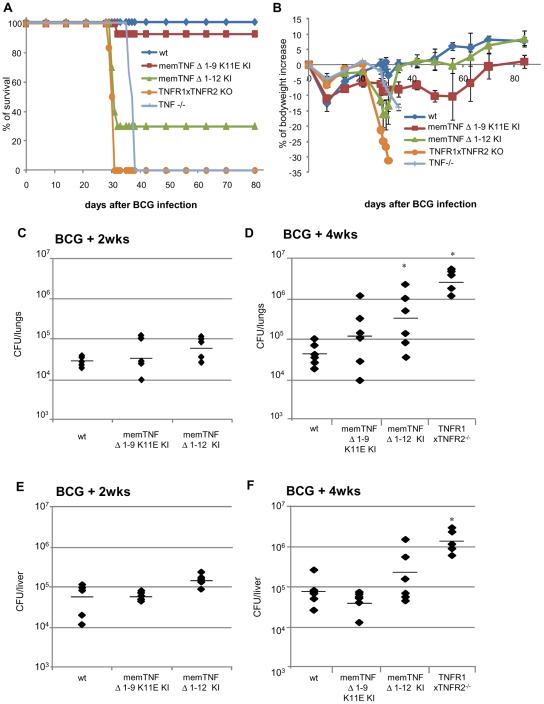
Figure 1. Survival curve, body weight and bacterial loads in lung and liver of mice infected with 107CFU of M. bovis BCG.
(A) Long-term survival of mice infected with living M. bovis BCG Connaught (107). (B) Body weight change after M. bovis BCG infection. Wild-type and memTNFΔ1–9,K11E KI, (n = 14 mice per group), memTNFΔ1–12 (n = 10 mice), and TNF−/− mice (n = 6 per group). Data from two representative experiments are shown. CFU were determined in lungs (C, D) and liver (E, F) at 2 and 4 weeks after infection with 107 CFU of M. bovis BCG. Data are represented as individual values and horizontal bars indicate mean (n = 4–6 mice per group). Asterisks indicate statistically significant differences between wild type and indicated group (*, p<0.03).

