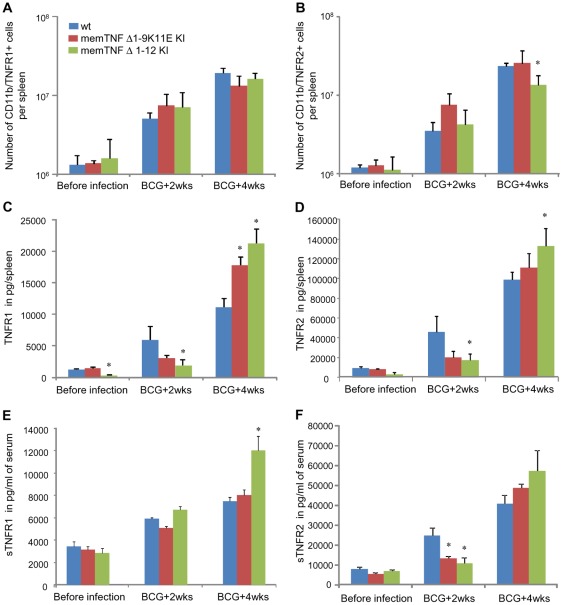
Figure 7. Lower number of macrophages expressing membrane bound TNFR2 but higher soluble TNFRs in memTNFΔ1–12 KI mice.
FACS analyses showing number of spleen CD11b+ cells expressing membrane TNFR1 (A) or TNFR2 (B) before or during M. bovis BCG infection. Results are shown as means ± SEM of spleen cell numbers (n = 3–4). *, p<0.02 compared to wild-type mice. Total amounts of TNFR1 (C) and TNFR2 (D) were evaluated on total spleen extracts during M. bovis BCG infection. Results are shown as means ± SEM of pg per spleen (n = 4–6). *, p<0.05 compared to wild-type mice. Amounts of solTNFR1 (E) and solTNFR2 (F) were assessed in the serum of mice before and after infection. Results as represented as means ± SEM of pg/ml of serum (n = 6–10). *, p<0.05 compared to wild-type.

