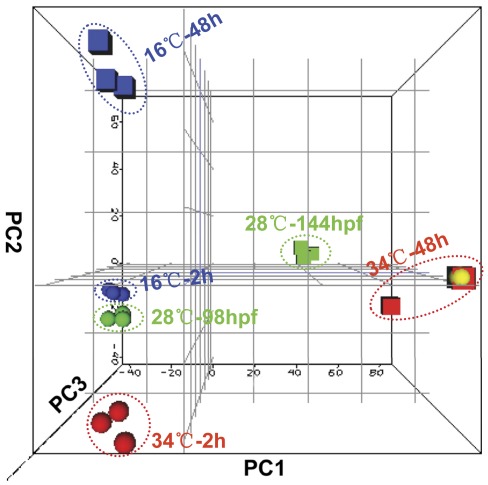
Figure 3. Principle component analysis (PCA) of gene expression profiles.
Normalized signal intensity values of all the probes called “present” in at least 2/3 (12) arrays were subjected to PCA using ArrayTrack. The x-, y- and z-axes represent PC1, PC2 and PC3, respectively. The colors and shapes of data points indicate temperature treatment and time of exposure: blue for cold (16°C), red for heat (34°C) and green for control (28°C), sphere for 2 h and square for 48 h after exposure. One of two overlapped heat-treated samples at 48 h is shown as yellow and sphere. The sample names were displayed within the figure.

