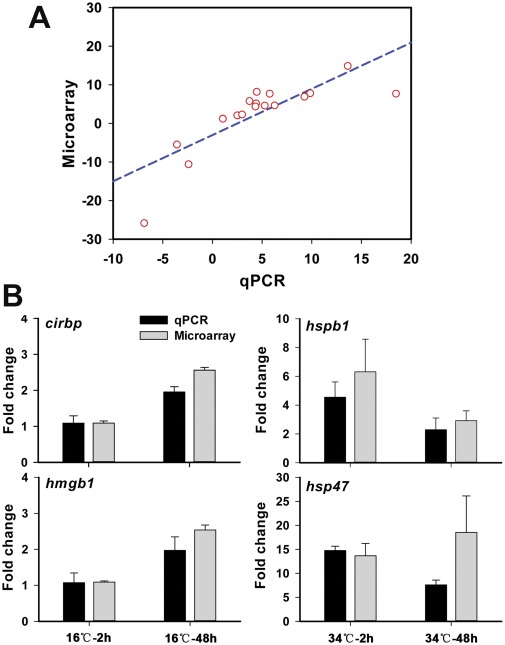
Figure 4. Validation of microarray data by qPCR.
(A) Correlation between qPCR (x-axis) and microarray (y-axis) data. The numeric expression values of genes in selected samples were displayed in Table S3. The correlation between microarray and qPCR data were analyzed by Spearman’s rho test. Highly statistical significance [r (17) = 0.916, p = 0.00001] was observed. (B) Pair wise comparison of microarray and qPCR data for temperature stress-related marker genes. The expression of cirbp and hmgb1 was detected in cold-treated samples (16°C-2 h and 16°C-48 h), and the expression of hspb1 and hsp47 were detected in heat-treated samples (34°C-2 h and 34°C-48 h), respectively. Error bars indicate standard deviations (n = 3).

