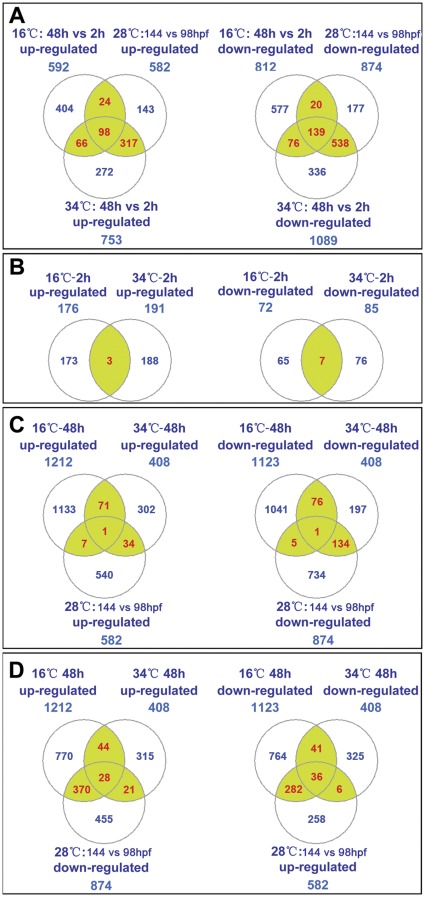
Figure 5. Venn diagrams represent the number of differentially expressed genes.
(A) Developmental processes-associated genes under 16, 28 and 34°C. Differentially expressed genes were identified by comparing their expression in 144 hpf samples (48 h after exposure) to that in 98 hpf samples (2 h after exposure) at the same temperature. (B) Temperature stress-regulated genes after 2 h of exposure. Differentially expressed genes were identified by comparing the expression of genes in 16°C-2 h and 34°C-2 h samples to that in 28°C-98 hpf samples. (C and D) Overlap between temperature-regulated genes and developmental processes-associated genes. Genes differentially expressed in 16°C-48 h and 34°C-48 h samples were compared to the development processes-associated genes identified from larvae maintained at 28°C?(28°C-144 hpf vs. 28°C-98 hpf). The official symbols of genes differentially expressed under different situations were displayed in Table S6.

