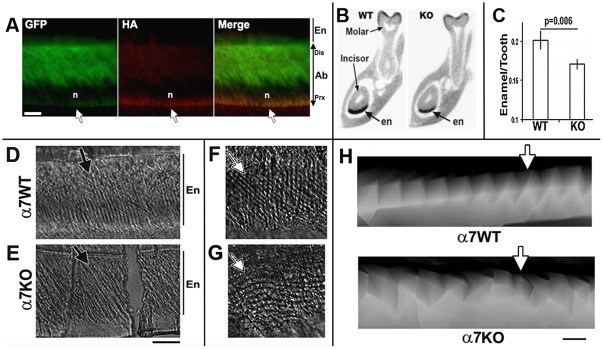
Figure 5. Ameloblasts express α7GFP and enamel structure is altered in α7KO mice.
A) Image of mandibular incisor (P12) showing co-labeling for GFP (α7GFP) and the α7-associated hemagglutinin epitope tag (HA). GFP fills the cells expressing α7 (except the nucleus which excludes this protein), the HA immunostaining is located only on the cell's basal (proximal) surface (arrow) indicating the majority of α7 receptors are accumulated at this site. The nuclear layer (not stained) is identified (n). The labels identify the ameloblast (Ab) and enamel (en). Distal (dis) and proximal (Prx) directions are noted. B) A virtual coronal cross-section made through the same region of an adult mouse of the α7WT or α7KO using high resolution μCT scanning (see methods). Because incisors are continually renewed, the enamel density is very consistent among animals whereas similar calculations of molar enamel volume were not measured due to the variability among animals presumably due to enamel attrition. This can be seen along the molar crown where the intensity of black varies and is not always continuous. The incisor and first mandibular molar are identified. In these images surrounding bone and material of similar or less density is colored grey whereas enamel (en) is in black. The volume of the mandibular incisor enamel and the total cross-sectional volume was calculated and summarized from images similar to these of multiple animals (see text). Note that the α7KO enamel appears to be ‘thinner’ relative to the matched image taken from an α7WT litter mate. C) Results of quantitation of enamel volume from 5 bilateral μCT image slices at matched anatomical intervals (dorsal to posterior) between α7WT and α7KO mice. The data from each section were averaged to obtain an animal mean that were then summarized for all animals of each genotype to generate the graph shown. The relative volume of enamel is consistently ∼25% less in the α7KO than in the α7WT (P = 0.006). Error bars are +/− standard error of the mean. D–E) Phase contrast microscopy of enamel from the mandibular incisor of an adult α7WT (WT) or α7KO (KO) mouse incisor. The enamel rod layer is visible (black bars identified by En) as parallel arrays in roughly perpendicular columns (arrows) relative to the external surface (bottom of photo). F–G) A view at greater magnification of a cross section shows the regularity of the rod lattice of the α7WT enamel that appear as less regular and often tilted relative to the perpendicular axis in the α7KO (arrows). H) High resolution μCT images of the lower mandibular incisor near the site of eruption showing enamel rods (collections of bundled prisms). The columns within the enamel in the α7WT (G) are regular and neatly ordered (arrow). This is in contrast to the α7KO (H) where columns are irregular and often are difficult to resolve. Although not apparent in these images, the spacing between the columns is not different indicating that the overall size and growth rate does not differ between mice of these genotypes (not shown). Bars = 50 µm (A); 100 µm, (D–G); 20 µm (A).

