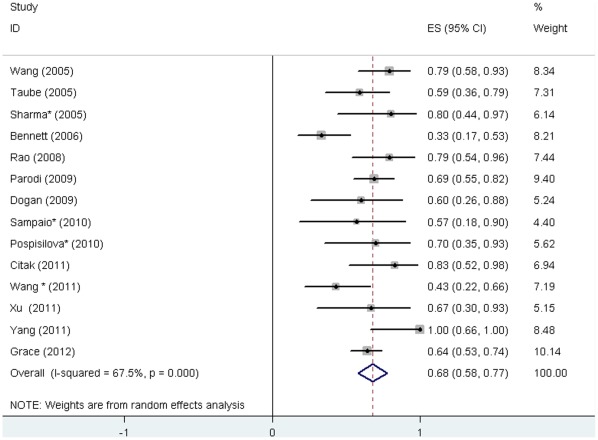
Figure 2. Response rate to rituximab in children with ITP.
This forest plot is created by the software of STATA 11.1. Solid boxes indicate the response rate in each study. Horizontal lines indicated 95% CIs. The diamond indicates the pooled response rate (68%). Test of heterogeneity: I2 = 67.5%, P<0.001.

