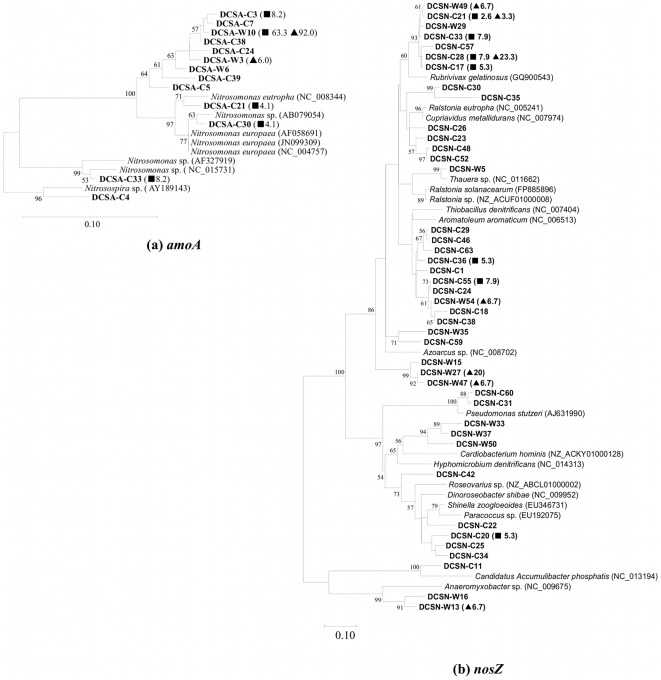
Figure 3. Phylogenetic trees with the (a) amoA and (b) nosZ representative sequences (OTUs) from Dianchi Lake sediments (Sampled in Dec. of 2010).
The numbers on the branch nodes represent percentage of bootstrap resamplings based on 1000 replicates (only ≥50% are shown). The scale bar indicates the number of nucleotide substitutions per site. The relative abundance of each OTU (comprising 2 or more clones) in the amoA or nosZ clone library is shown in parentheses. Additional symbols for abundance are (▪) Caohai and (▴) Waihai.

