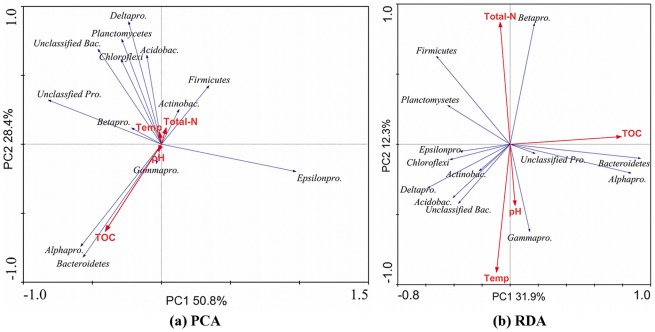
Figure 5. Principal components analysis (PCA) and Redundancy analysis (RDA) with of bacterial communities as affected by sediment properties, based on the relative abundance of dominant bacterial phyla and proteobacterial classes.
Total-N represents NH3-N+NO2 −-N+NO3 −-N. Abbreviations in figure: Temp, temperature; Actinobac., Actinobacteria; Alphapro., Alphaproteobacteria; Betapro., Betaproteobacteria; Deltapro., Deltaproteobacteria; Gammapro.,Gammaproteobacteria; Acidobac., Acidobacteria; Unclassified bac., Unclassified bacteria; Unclassified Pro., Unclassified Proteobacteria. Epsilonpro., Epsilonproteobacteria.

