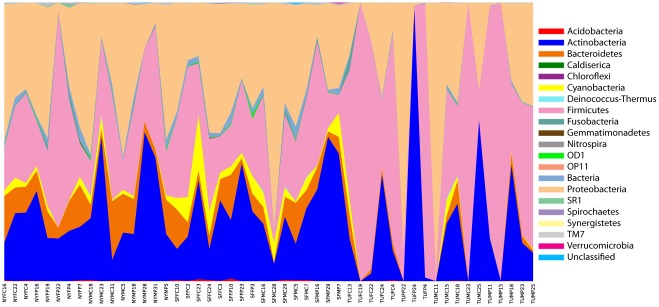
Figure 2. Relative abundance of bacterial divisions across samples.
The abundances of various bacterial divisions (see color legend) in the 54 samples were based on multiplexed pyrosequencing of 16S rRNA gene sequences. The codes for each sample are presented along the X-axis and indicate the city (NY = New York, SF = San Francisco, TU = Tucson), gender of the office occupant (F = Female, M = Male), and site within the office from which the sample (C = Chair, P = Phone) was obtained, followed by sample number.

