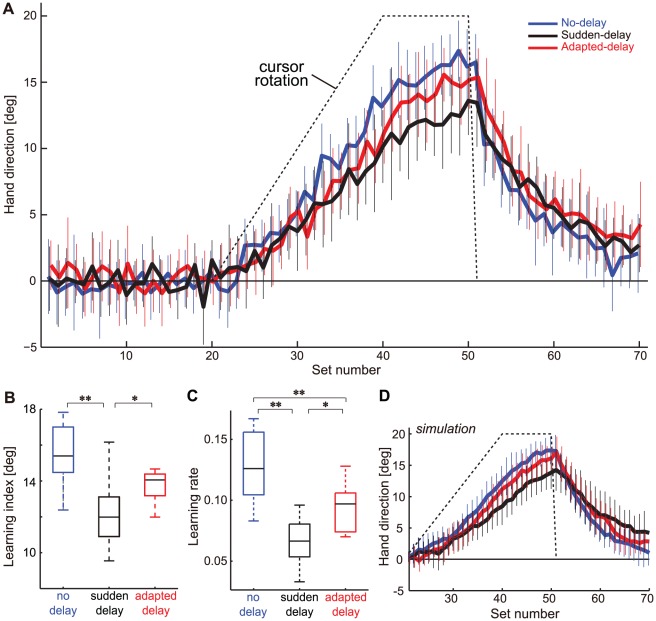
Figure 2. Experimental results.
(A) Changes in hand directions for the 3 conditions (blue, no-delay; black, sudden-delay; red, adapted-delay). The broken line indicates the imposed visuomotor rotation. Values are shown as mean ± SD for all participants. (B) Learning indices and (C) learning rates for the 3 conditions. The vertical broken lines at the top and bottom of the box plots represent the maximum and minimum values, respectively. The rectangles represent the inter-quartile range (first to third quartile), and the horizontal bars in the rectangles represent the median of each variable. The asterisks indicate a significant difference (*P<0.05, **P<0.01). (D) The results of simulation with the identified state-space model.

