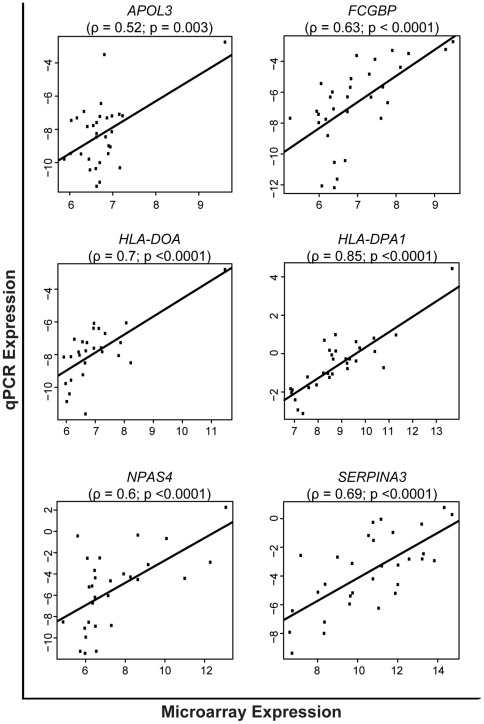
Figure 5. Test of the correlation between microarray and qPCR data.
Y-axis shows mRNA expression levels [–DCt values (Ct reference–Ct target)] derived from qPCR experiments whereas the X-axis shows the log2 normalized microarray expression signal intensities. Correlations were considered significant when p<0.05. ρ = correlation coefficient.

