Fig. 4.
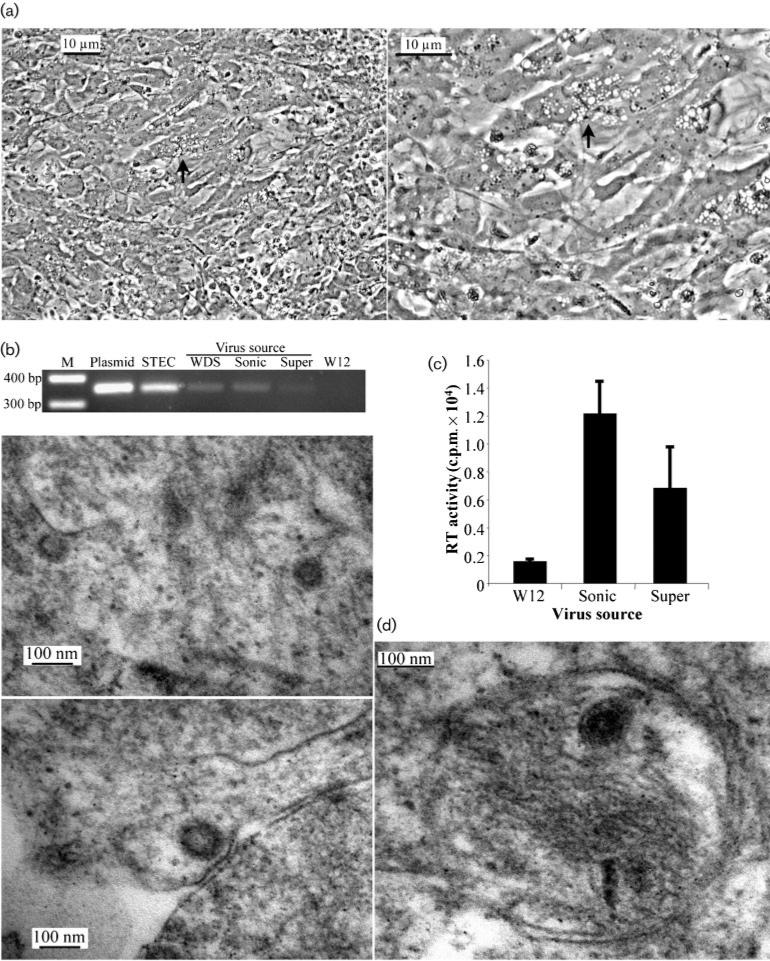
(a) Phase-contrast micrograph illustrating the vacuolization observed in confluent STECs (arrow) at a magnification of ×200 (left) and ×400 (right). (b) Amplicons of the 354 bp gag sequence from DNA of W12 cells infected with virus from WDS tumour homogenate (WDS), sonicated STECs (Sonic) or STEC supernatant virus (Super). Controls comprised 20 pg WDSV clone DNA (Plasmid), 1 μg STEC DNA (STEC) and 1 μg W12 DNA (W12). (c) RT activity of supernatants from W12 cells (W12) or cells infected with virus from STEC sonicate (Sonic) or STEC supernatant (Super). (d) TEM micrographs illustrating intracellular WDSV in STECs at a magnification of ×70 000 (left panels) and ×100 000 (right panel). M, Molecular mass marker.

