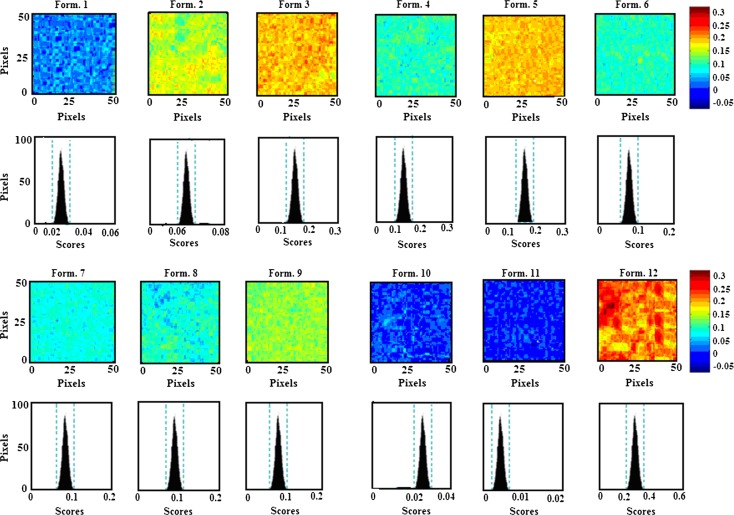
Fig. 12.
PLS images and associated histograms of the 12 formulations. The same scale (on right) is used for all images, with the highest intensity of 0.3 representing letrozole and the lowest intensity of −0.05 representing PLGA. The images show formulation 12 with the highest drug loading while formulation 11 had the lowest drug loading. The color codes based on the scale for the formulations are in agreement with the order of drug loading determined by RP-HPLC

