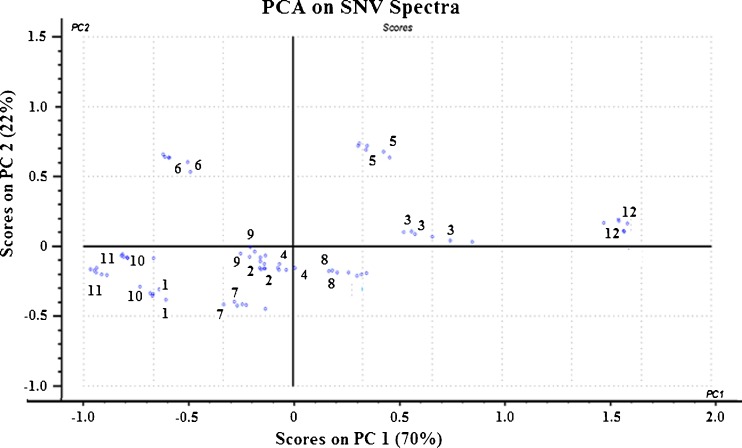
Fig. 7.
Principal component analysis score plot of PC1 against PC2 for SNV-treated NIR spectra showed a clear pattern of clusters along PC 1 axis. From left to right, the order off the sequence coincided with an increasing order of drug loading in the nanoparticle as determined by RP-HPLC. This shows that PC 1 correlates with the amount of drug while PC 2 explains the variance in the PLGA content

