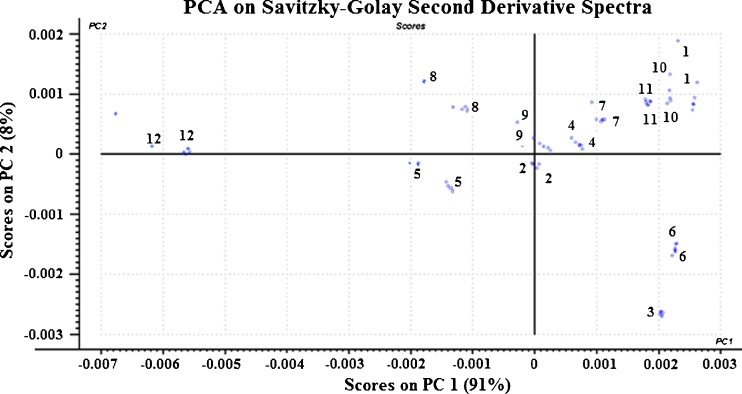
Fig. 8.
Principal component analysis score plot for PC1 and PC2 for Savitzky–Golay second derivative-transformed NIR spectra. Second derivative transformation resulted in the splitting of overlapping peaks and the introduction of peaks and troughs. As a result, there were no clear pattern of clusters along the PC 1 axis

