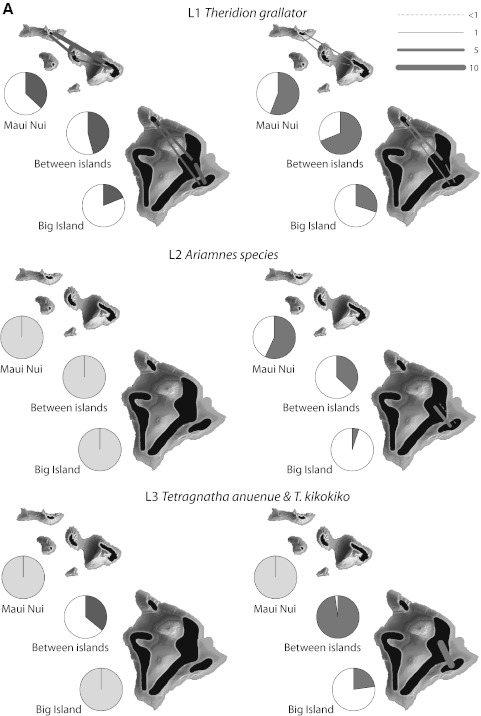
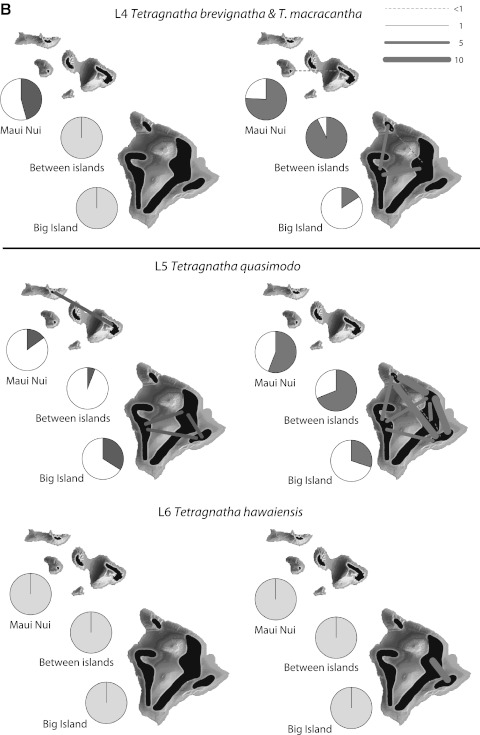
Fig. 3.
Genetic differentiation at different spatial scales based on data from nuclear allozymes (red, left side) and mitochondrial COI sequences (blue, right side). Pies show estimated  , the standardized proportion of genetic variation distributed among populations for volcanoes on Maui Nui, between islands, and among volcanoes on the Big Island; where comparisons were not possible because of limited samples or localities, pies are gray. Thickness of lines on the maps show the magnitude of pairwise gene flow (N
e
m) between populations estimated from nuclear allozymes (red, left) and mitochondrial COI sequences (blue, right), where sample sizes permitted. See text and Fig. 2 for descriptions of each lineage (Color figure online)


