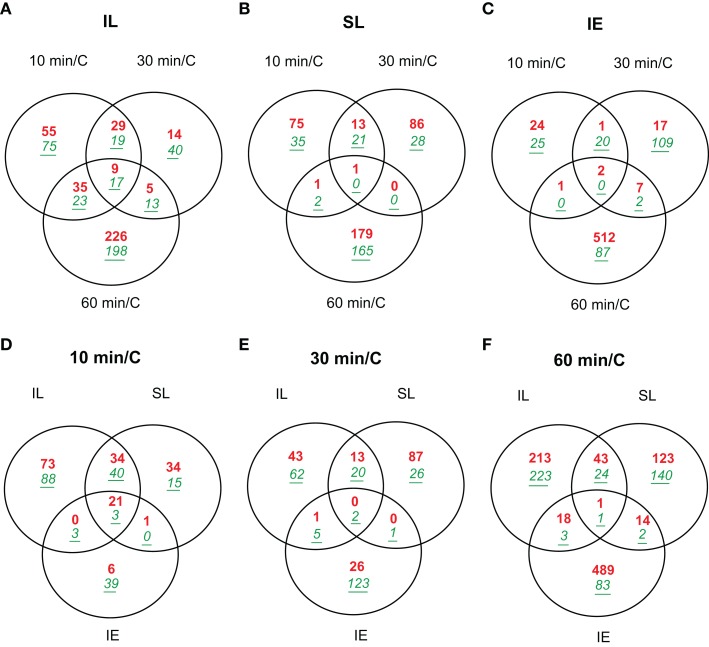
Figure 2.
Venn diagrams comparing transcriptome changes in leaves and immature ears from UV-B-irradiated plants in only two adult leaves compared to non-irradiated control plants (C). Plants were irradiated over a time course of 10, 30, and 60 min. Intersection of genes differentially expressed in irradiated leaves (A); shielded leaves (B); and immature ears (C) during 10, 30, and 60 min. Intersection of genes differentially expressed after 10 min (D); 30 min (E); and 60 min (F) in IL, SL, and IE. Transcripts showing changes higher than two-fold (p < 0.05) were included in the classification. Up-regulated transcripts are in red (bold), down-regulated transcripts are in green (italics, underlined).

