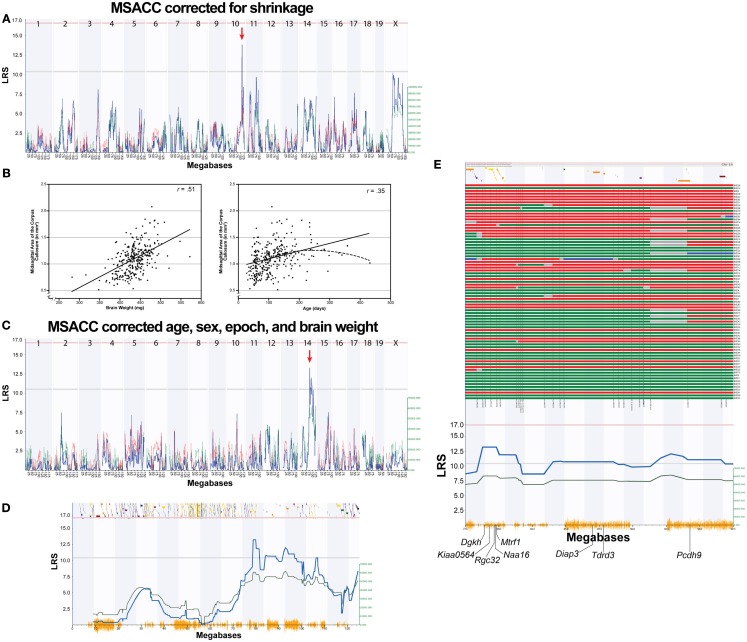
Figure 2.
Mapping MSACC in BXD RI strains. (A). Interval map of MSACC corrected for histological shrinkage across the entire genome. The x-axis represents the physical map of the genome; the y-axis and thick blue line provide the LRS of the association between the trait and the genotypes of markers. The two horizontal lines are the suggestive (blue) and significance (red) thresholds computed using 2000 permutations. There is a suggestive QTL mapping to the distal portion of Chr. 10 (red arrow). (B) Correlations between MSACC and brain weight (left) and age (right) indicate that these two variables significantly contribute to MSACC. Solid lines indicate linear relationship of the variable. Dotted line indicates quadratic relationship of the variables. (C) Interval map of MSACC corrected for shrinkage with the effects of age, sex, epoch, and brain weight regressed out. There is a suggestive QTL on Chr 14 (red arrow). (D) Interval map of all of Chr 14. Green line indicates contribution of DBA/2J alleles. Orange lines on x-axis represent high density SNP map. Discontinuous track along the top are the genes on this chromosome. (E) Haplotype map of all 76 BXD strains on 20 Mb QTL interval on Chr14 (77.5–97.5 Mb). Red lines indicate C57BL/6J alleles (maternal), green lines indicate DBA/2J alleles (paternal), blue lines indicate heterozygous alleles, and gray lines are unknown. Strains are arranged from smallest to largest MSACC (top to bottom).

