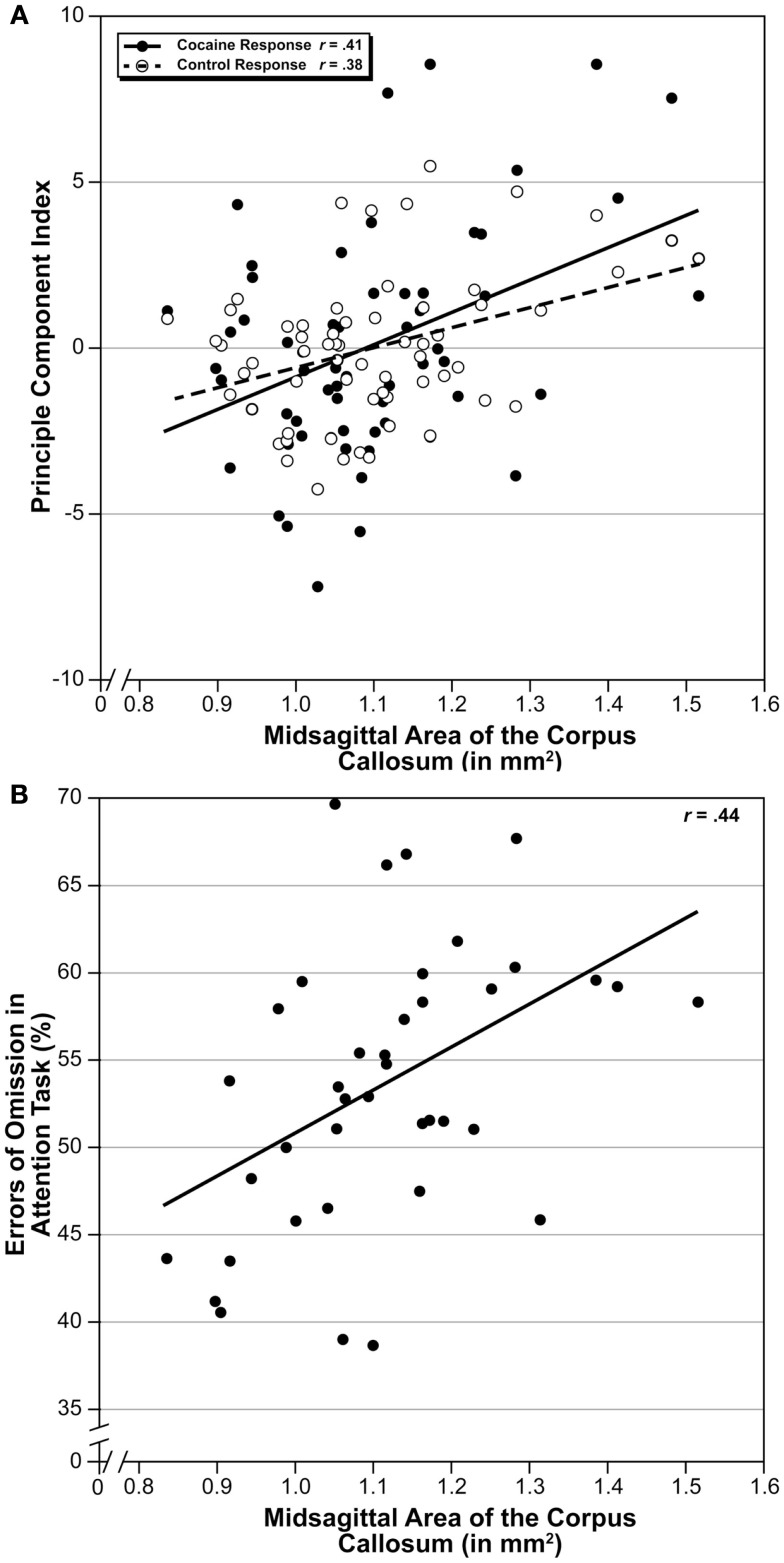
Figure 4.
Covariation of MSACC with behavioral traits. (A) Scatterplot of MSACC correlated with principle component comprised of 12 traits measuring locomotor response to cocaine administration (Philip et al., 2010; black circles) and four traits measuring the same response following saline administration from the same study (white circles). Solid line is linear correlation of cocaine response, and dotted line is linear correlation of saline response. (B) Scatterplot of MSACC correlated with errors of omission on a test of attention.

