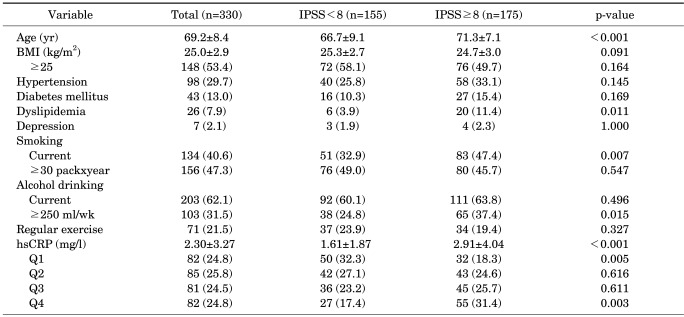
TABLE 1.
Association of different variables with the severity of LUTS
Values are presented as mean±SD or number (%).
LUTS, lower urinary tract symptoms; IPSS, International Prostate Symptom Score; BMI, body mass index; hsCRP, high sensitivity c-reactive protein; Q1, first hsCRP quartile (hsCRP≤0.68 mg/l); Q2, second hsCRP quartile (0.68<hsCRP≤1.19 mg/l); Q3, third hsCRP quartile (1.19<hsCRP≤2.26 mg/l); Q4, fourth hsCRP quartile (hsCRP>2.26 mg/l).

