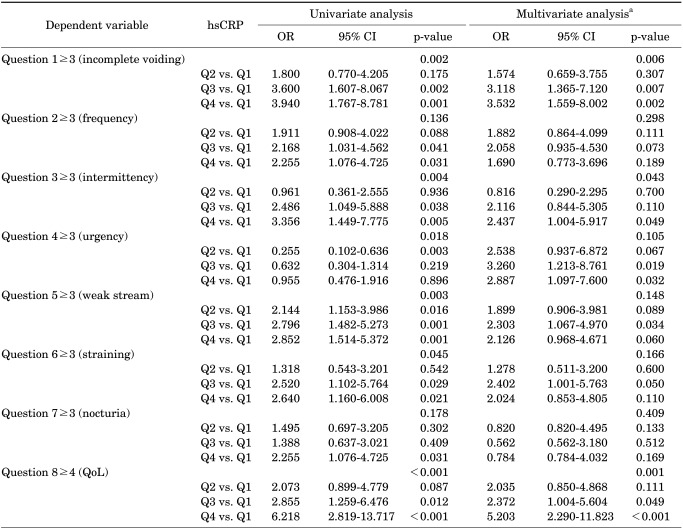
TABLE 3.
Univariate and multivariate logistic regression analyses on predictors of the individual symptoms of the IPSS
IPSS, International Prostate Symptom Score; hsCRP, high sensitivity c-reactive protein; OR, odds ratio; CI, confidence interval; QoL, quality of life; Q1, first hsCRP quartile (hsCRP≤0.68 mg/l); Q2, second hsCRP quartile (0.68<hsCRP≤1.19 mg/l); Q3, third hsCRP quartile (1.19<hsCRP≤2.26 mg/l); Q4, fourth hsCRP quartile (hsCRP>2.26 mg/l).
a: Adjusted for age, body mass index, hypertension, diabetes mellitus, dyslipidemia, depression, smoking, alcohol drinking, and regular exercise.

