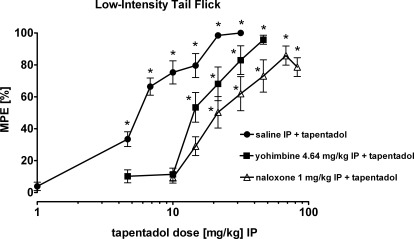
Fig. 4.
Naloxone shifted the dose-response curve of tapentadol farther to the right than yohimbine in the low-intensity tail-flick test in rats. Data are presented as percentage of MPE (mean ± S.E.M.) 10 min after intraperitoneal administration of tapentadol. *, P < 0.05 versus corresponding vehicle. Administration of vehicle and antagonists alone did not produce antinociceptive effects. The respective percentages of MPE (mean ± S.E.M.) 10 min after the second intraperitoneal administration were as follows: saline intraperitoneally + saline intraperitoneally, 0.2 ± 4.0; naloxone 1 mg/kg i.p. + saline intraperitoneally, 2.1 ± 2.9; yohimbine 4.64 mg/kg i.p. + saline intraperitoneally, −4.2 ± 3.0.

