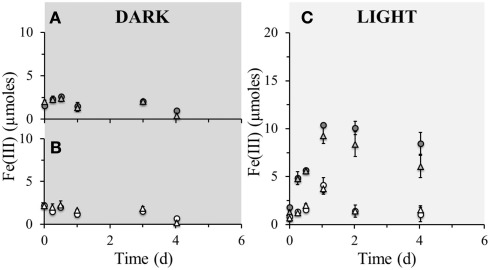
Figure 3.
Poorly crystalline Fe(III) formation in microcosm incubations (y-axis shows total Fe(III) content per microcosm set-up) over a period of 4 days at 23°C. Closed circles ( ) represent biotic set-ups with 10 mM Fe(II) amendment whilst open circles (
 ) represent parallel sterile set-ups (160 mM NaN3 addition) with the same amendment. Closed triangles (
 ) represent biotic set-ups with 10 mM Fe(II) and 10 mM amendment and open triangles (
 ) represent parallel sterile set-ups (160 mM NaN3 addition) with the same amendments. (A) Comparison of microbially active dark set-up of solely Fe(II) amendment with Fe(II) and supplementary amendments. (B) Comparison of sterile dark set-up of solely Fe(II) amendment with Fe(II) and supplementary amendments. (C) Comparison of microbially active and sterile light set-ups of solely Fe(II) amendment with Fe(II) and supplementary amendments. Error bars indicate minimum and maximum Fe(III) values from duplicates.

