
Figure 7.
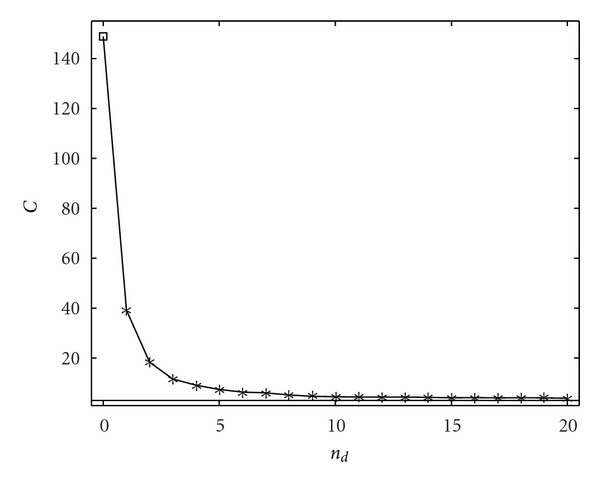
Concerning the preictal period, the sum of all causalities is plotted versus the number of conditioning variables.
Official websites use .gov
A
.gov website belongs to an official
government organization in the United States.
Secure .gov websites use HTTPS
A lock (
) or https:// means you've safely
connected to the .gov website. Share sensitive
information only on official, secure websites.
Concerning the preictal period, the sum of all causalities is plotted versus the number of conditioning variables.