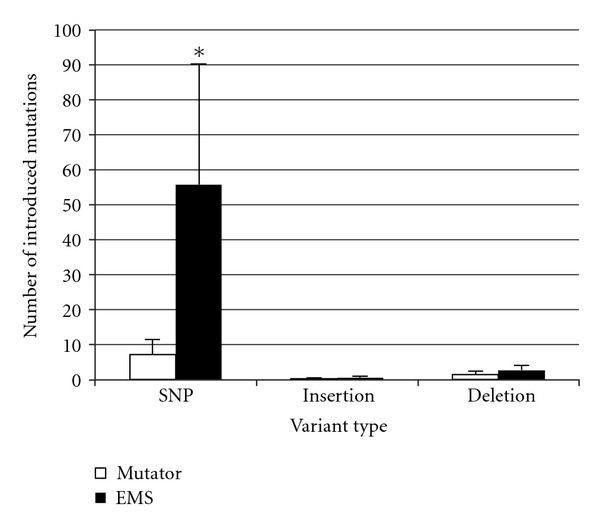
Figure 1.

Average number of introduced mutations. By subtracting parental mutations from each mutagenized strain, we determined the number of mutations that were introduced by each mutagen. Bars represent mean ± standard error for 5 clones. *P < 0.05 versus mutator in a two-sample t-test.
