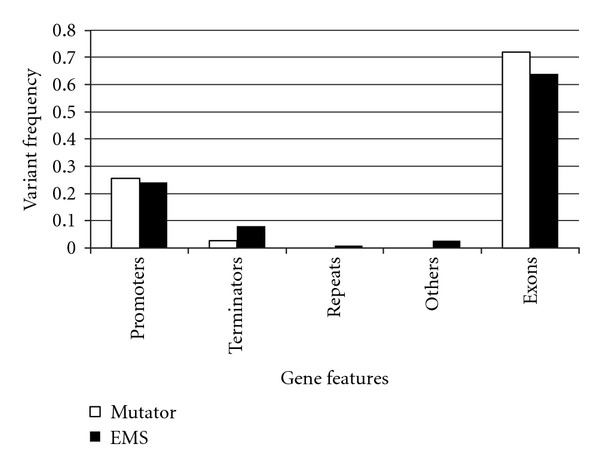
Figure 2.

Relative frequency of SNVs affecting various gene features. The mutator and EMS generated mutations that were distributed similarly across the various gene features. The data for individual strains were combined according to the mutagen used. Promoters indicate the region 1 kb upstream of each gene. Terminators indicate the region 200 bp downstream of each gene.
