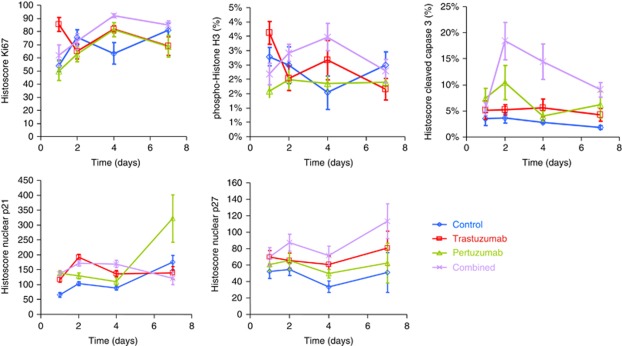
Figure 4.
Effect of single or combination therapy on proliferation, cell cycle, apoptosis and protein markers over time. Total and phosphoprotein levels were determined by immunohistochemistry of TMAs for Ki67, phopho-histone H3, cleaved caspase 3, p21 and p27. See Supplementary Figure 3 for comparable AQUA quantitative immunofluorescence results.

