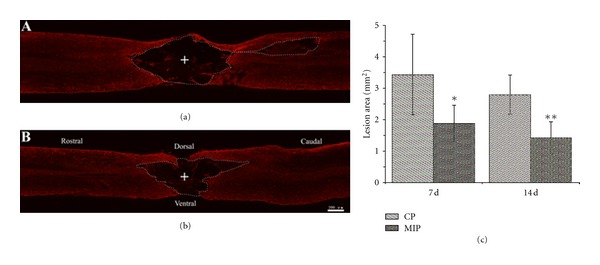
Figure 6.

GFAP immunohistochemical staining in the spinal cord section at 7 d and 14 d after injury. (a) and (b) represent pictures of GFAP-stained sections of spinal cord in CP and MIP groups at 14d after injury, respectively. The boundary of the lesion area was dot-lined, according to the GFAP immunoreactive product. The cross indicates the epicenter of the lesion. (c) is the histogram of the lesion area in CP and MIP groups. There was a significant difference between the two groups at 7 d (*P < 0.05) and 14 d after injury (**P < 0.01). Scale bar = 200 μm.
