
Figure 5.
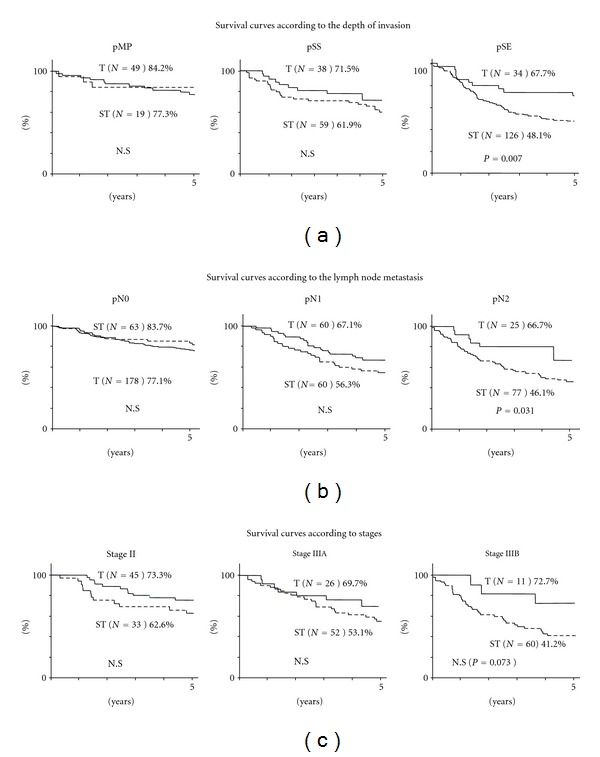
(a) Cumulative survival rates according to the depth of invasion (pT). As for pMP and pSS, there was no difference between T group and ST group, but the survival of the T group with pSE was better than that of ST group with pSE (P = 0.007). (b) Cumulative survival rates according to lymph node metastasis (pN). There was no difference in the cumulative survival rates between two groups with pN0 and pN1, but the survival of T group with pN2 was better than that of ST group with pN2 (P = 0.031). (c) Cumulative survival curves according to stage (pStage). There was no significant difference in the cumulative survival rates between two groups with Stage II, Stage IIIA, and Stage IIIB.