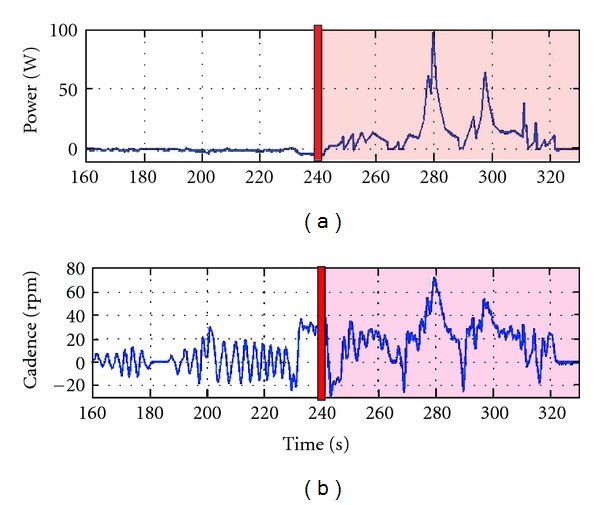
Figure 5.

Cycling performance during the initial application of FES in a child for whom cycling was a novel task (participant 2). The top trace (a) illustrates his power output and the bottom trace (b) illustrates his cadence. The red vertical bars at 240 s indicate when FES assistance began and FES remained on during the red-shaded portion of the graph. Data were smoothed for analysis using a second-order lowpass Butterworth filter with a cutoff frequency of 0.1 Hz.
