
Figure 2.
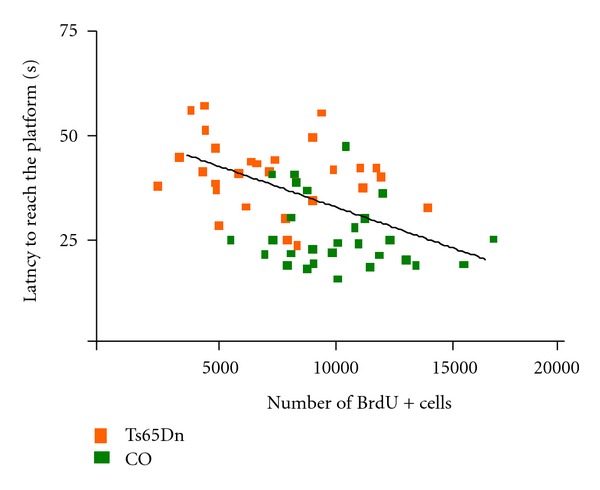
Correlation between performance in the Morris water maze (mean latency to reach the platform) and the number of BrdU+ cells in the DG of Ts65Dn and euploid littermates (Rueda et al., unpublished results; Pearson's R: −0.4647; P < 0.001).
Official websites use .gov
A
.gov website belongs to an official
government organization in the United States.
Secure .gov websites use HTTPS
A lock (
) or https:// means you've safely
connected to the .gov website. Share sensitive
information only on official, secure websites.
Correlation between performance in the Morris water maze (mean latency to reach the platform) and the number of BrdU+ cells in the DG of Ts65Dn and euploid littermates (Rueda et al., unpublished results; Pearson's R: −0.4647; P < 0.001).