
Figure 3.
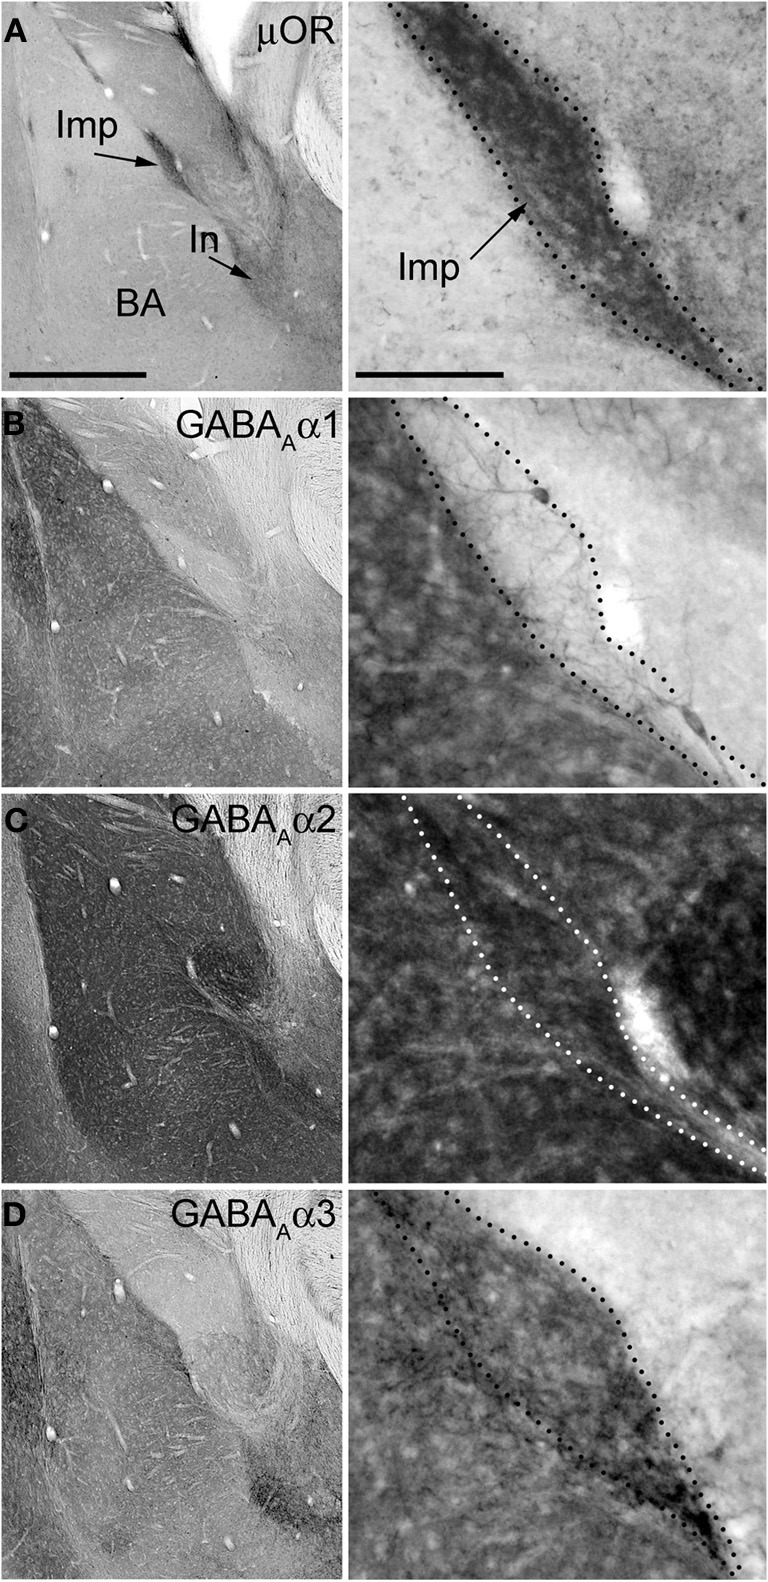
Immunostainings for μ-opioid receptor and GABAA receptor subunits α1–3 in consecutive sections of the mouse amygdala. Panels on the left show low magnification images of the basolateral (BL) complex and intercalated cell masses, whereas the panels on the right show a higher magnification of the Imp cluster. (A) Immunoreactivity for μOR is particularly enriched in the intercalated cell masses such as the Imp and In (as indicated by the arrows). (B) Immunoreactivity for the α1 subunit is very intense in the BL complex whereas it is undetectable in the Imp, although a few dendrites can be observed coursing across it and probably belonging to the strongly labeled large neurons located at the edges of the cluster. (C) The expression of the α2 subunit appears particularly strong in both the BL complex and intercalated cell masses, including the Imp. (D) Immunoreactivity for the α3 subunit can be observed throughout the amygdala although the intercalated cell masses display a stronger signal compared to the BL complex and central nucleus. Abbreviations: BA, basal nucleus of the amygdala; Imp, medial paracapsular intercalated cluster; In, main intercalated nucleus; μ-opioid receptor, μOR. Scale bars: left panel, 500 μm; right panel, 100 μm.