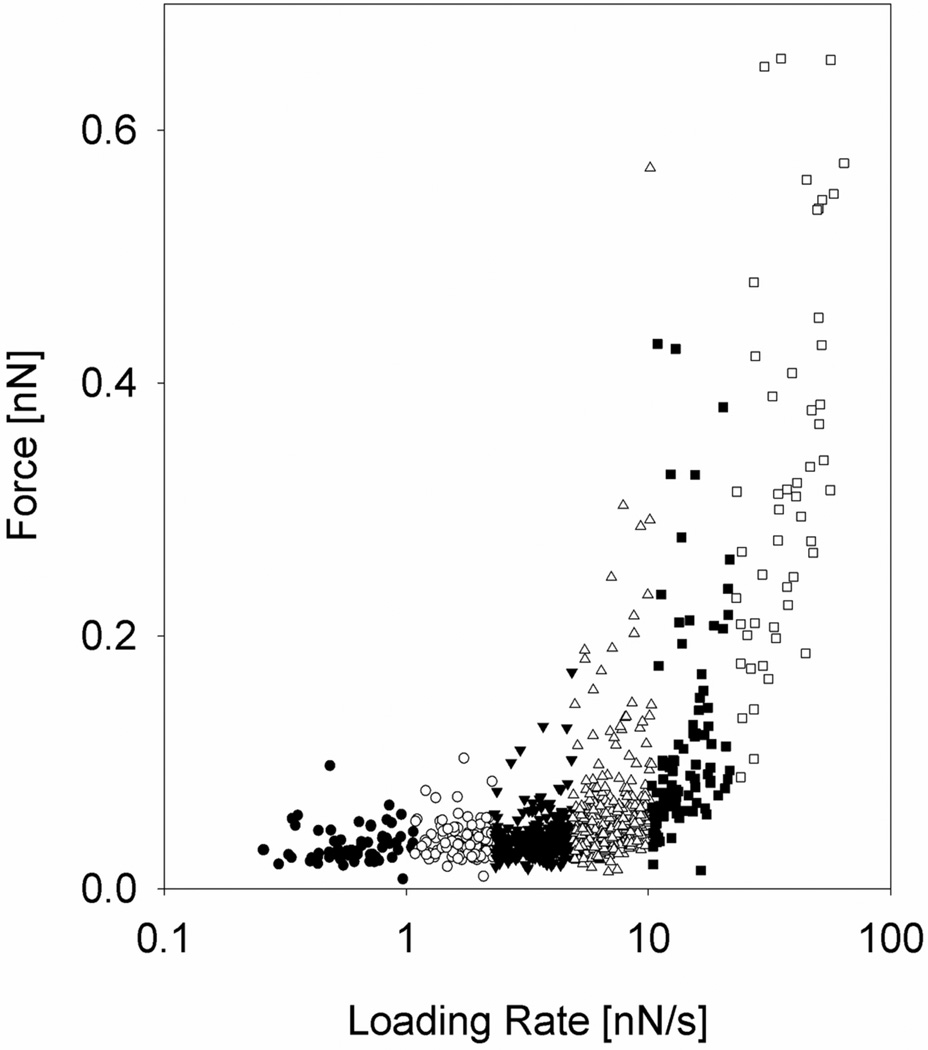
Figure 3.
Distribution of Tn-PSM self-interaction rupture forces at increasing force loading rates. The data are collected from 3922 force curves obtained using tip retraction speed in the interval 1–4 µm/s and no pause at the sample surface. The loading rate acting at a molecular bond was determined for each force jump from the slope Δf/Δt prior to each bond dissociation event. The observations were divided into 6 subgroups, each characterised by a certain range of loading rates. Each subgroup was analysed separately, and f* (large symbols), determined as explained in Figure 4.

