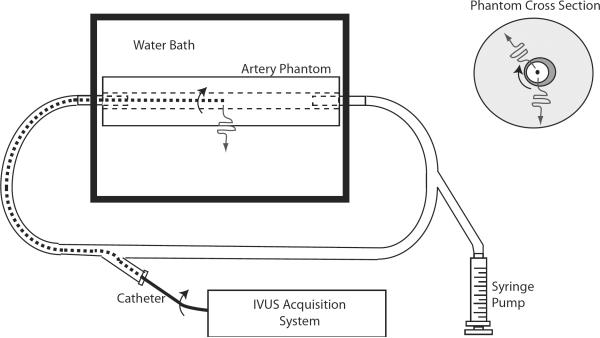
Figure 4.
Schematic diagram of the equipment used for phantom imaging. A cross section of the phantom is shown (upper right) with a dark region indicating the soft inclusion. The arced arrows indicate the rotation of the transducer and the wavy line indicates the sound propagation direction relative to the catheter. The experimental setup (lower left) includes the IVUS imaging system and the 40 MHz rotating-element catheters.

