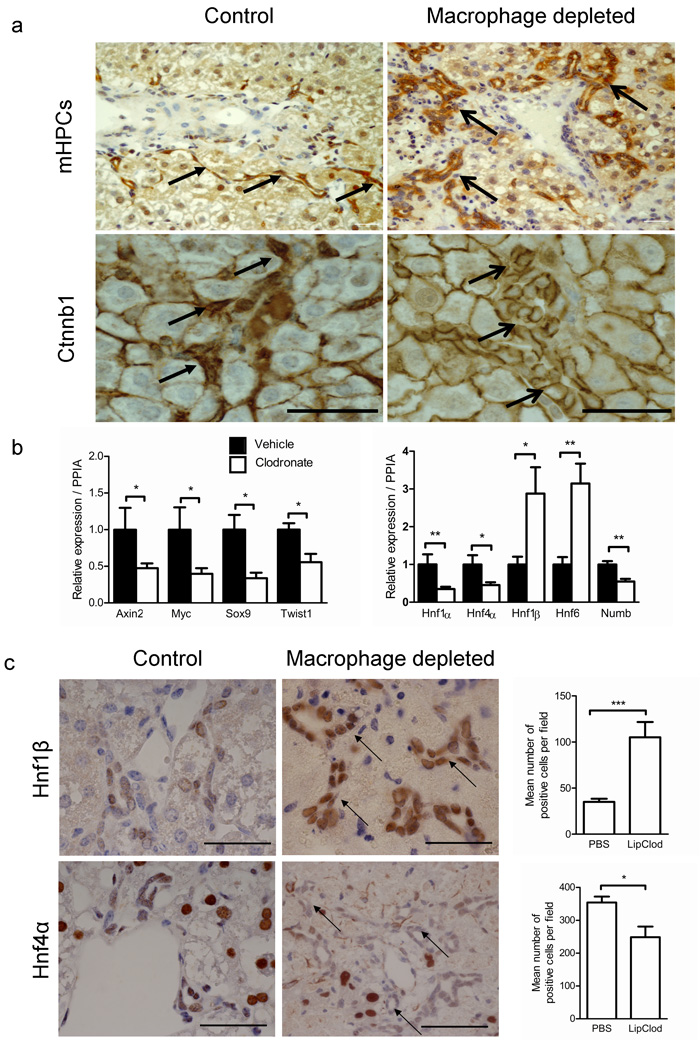
Figure 6. Ablation of Macrophages in vivo results in the re–specification of mHPCs.
(a) Upper panels panCK positive mHPCs during hepatocyte regeneration in the presence or absence of macrophages; lower panels, localisation of Ctnnb1 in mHPCs during hepatocyte regeneration in the presence or absence of macrophages. (b) Transcript expression of Wnt pathway targets and liver enriched transcription factors in mHPCs isolated from animals depleted for macrophages compared to PBS controls (c) Photomicrographs of Hnf1β (upper panels) and Hnf4α (lower panels) in mHPCs of livers depleted of macrophages or controls. This positivity is quantified as absolute number of Hnf1β or Hnf4α positive cells (upper and lower histogram respectively) in control vs. macrophage depleted animals. Data is expressed as means ± S.E.M; *P < 0.05, **P < 0.01, ***P < 0.001. liposomal clodronate and control n = 10. Scale bar = 100μm

