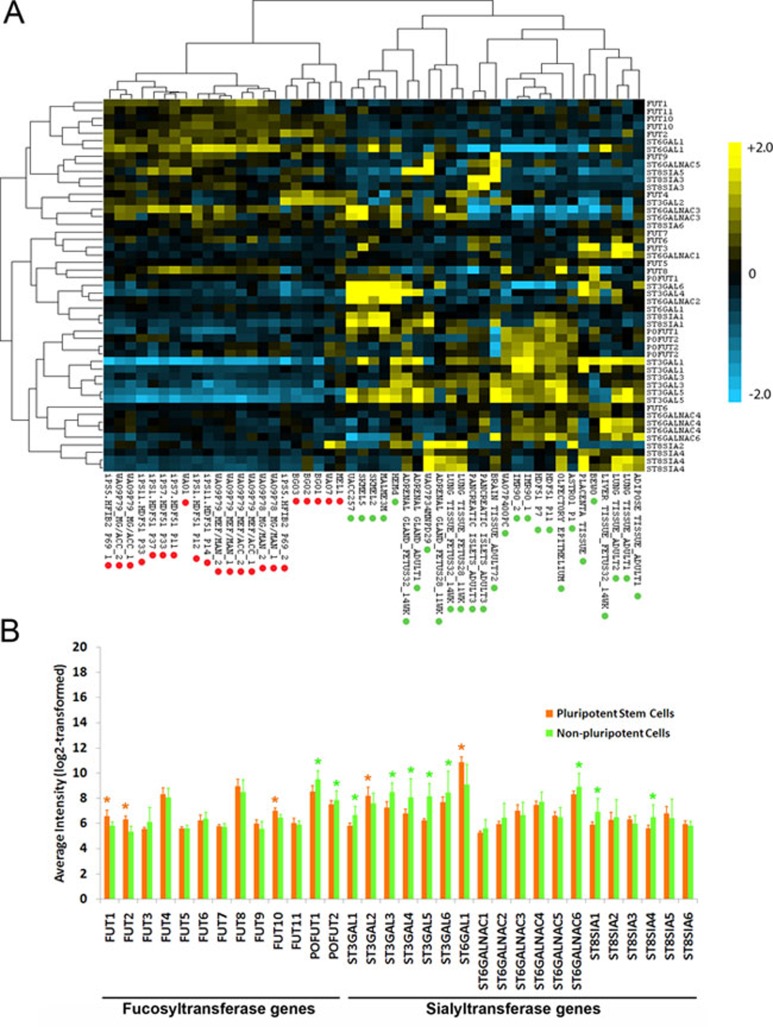
Figure 4.
Gene expression profiles of human fucosyltransferases and sialyltransferases in hPSCs and non-pluripotent cells. (A) RNA was hybridized to Illumina arrays as described in Materials and Methods. The heat-map representation of the array data indicates the relative expression levels of specific glycosyltransferases in the cells. The results of the hierarchical clustering of expression patterns in different cell types are illustrated as a dendrogram. Pluripotent and non-pluripotent cells are indicated by red and green dots, respectively. (B) The expression levels of 13 fucosyltransferases and 19 sialyltransferases in 22 samples of hPSCs (8 samples of hiPSCs and 14 samples of hESCs) and 27 samples of human non-pluripotent cells (14 samples of organ tissues and 13 samples of cultured cells). The fluorescence intensities of each gene probe were averaged, log2-transformed and plotted. Columns, mean of log2-transformed fluorescence intensities; bars, standard deviation. *P < 0.01, fold change of expression > 1.4 (differential expression analysis performed by GenePattern using non-transformed values of intensity).

