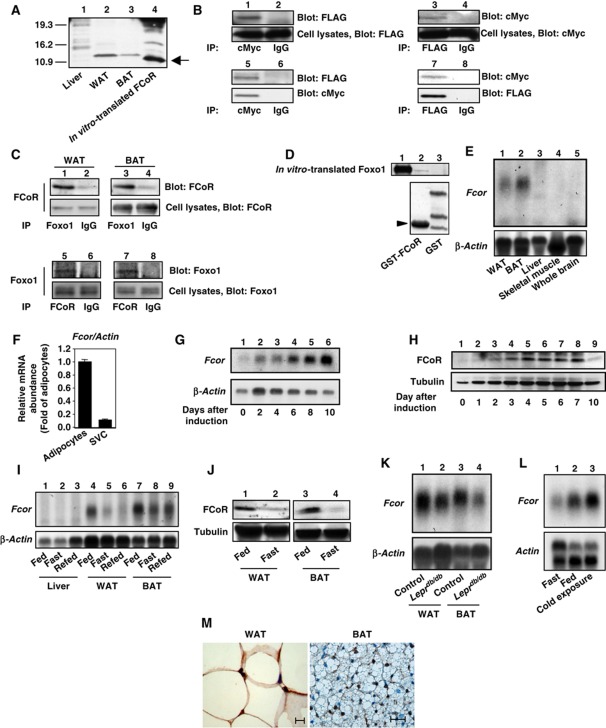
Figure 1.
Interaction between FCoR and Foxos and expression profiling of FCoR. (A) In-vitro translation of FCoR. Lysates from liver (lane 1), WAT (lane 2), and BAT (lane 3) from wild-type mice, along with in vitro-translated FCoR were analysed by western blotting using anti-mouse FCoR antiserum. (B) Interaction between exogenous FCoR and Foxo1. HEK293 cells were co-transfected with pFLAG-CMV2-WT Foxo1 or pFLAG-CMV2-Δ256 Foxo1 plus pCMV5-cMyc-WT FCoR and cultured in the presence of serum. At 48 h after transfection, cells were harvested and lysates were immunoprecipitated with anti-cMyc (lanes 1 and 5), anti-FLAG antibody (lanes 3 and 7), or normal mouse IgG (lanes 2, 4, 6, and 8) and blotted with anti-FLAG (lanes 1, 2, 5, and 6) or anti-cMyc antibody (lanes 3, 4, 7, and 8). (C) Interaction between endogenous Foxo1 and FCoR in WAT and BAT. Lysates from WAT (lanes 1, 2, 5, and 6) and BAT (lanes 3, 4, 7, and 8) were immunoprecipitated with anti-FOXO1 (lanes 1 and 3), anti-FCoR (lanes 5 and 6), or normal rabbit IgG (lanes 2, 4, 6, and 8) and blotted with anti-FCoR (lanes 1–4) or anti-FOXO1 (lanes 5–8), respectively. (D) Direct interaction of FCoR with Foxo1. GST-FCoR was subjected to a pull-down assay. Aliquots of in vitro-translated WT Foxo1 were incubated with glutathione-Sepharose beads coated with bacterially expressed GST-P13 (lane 2) or GST alone (lane 3) for 6 h at 4°C. The in vitro-translated Foxo1 proteins retained on the column were eluted and separated by SDS–PAGE followed by western blotting with anti-FOXO1 antibody. The bottom panel shows GST or GST-GST-P13 (10% of input, lane 3) blotted with anti-GST antibody. (E) Expression profiling of Fcor in various tissues. Total RNA isolated from WAT (lane 1), BAT (lane 2), liver (lane 3), skeletal muscle (lane 4), and whole brain (lane 5) of wild-type mice was subjected to northern blotting with Fcor (top panel) or β-actin (bottom panel). (F) Real-time PCR of Fcor using the adipocyte or stromal vascular fractions of fractionated WAT. (G) Northern blotting of 3T3-F442A cells during differentiation. Total RNA isolated from 3T3-F442A cells on the indicated day after induction of differentiation was subjected to Northern blotting with Fcor (top panel) or β-actin (bottom panel). (H) Western blotting of FCoR protein from 3T3-F442A cells during differentiation. Lysates from 3T3-F442A cells on the indicated day after induction of differentiation were subjected to western blotting using anti-FCoR polyclonal antiserum (top panel) or anti-tubulin monoclonal antibody (bottom panel). (I) Effects of the feeding state on Fcor gene expression. Total RNA from liver (lanes 1–3), WAT (lanes 4–6), and BAT (lanes 7–9) from C57Bl6J mice in the fed, fasting, or refed states was subjected to northern blotting with Fcor (top panel) or β-actin (bottom panel). (J) Western blotting of the FCoR protein from WAT (lanes 1 and 2) and BAT (lanes 3 and 4) from C57Bl6J mice in fed (lanes 1 and 3) or fasting state (lanes 2 and 4). Tissue lysates were subjected to western blotting using anti-FCoR polyclonal antiserum (top panel) or anti-tubulin monoclonal antibody (bottom panel). (K) Fcor gene expression in WAT and BAT from Leprdb/db mice. Total RNA isolated from WAT (lanes1 and 2) and BAT (lanes 3 and 4) of C57Bl6J (lanes 1 and 3) or Leprdb/db mice (lanes 2 and 4) was subjected to northern blotting with Fcor (top panel) or β-actin (bottom panel). (L) Effect of cold exposure on Fcor gene expression in BAT. Total RNA isolated from the BAT of C57Bl6J mice exposed to the cold (4°C for 6 h) was subjected to northern blotting with Fcor (top panel) or β-actin (bottom panel). (M) Immunohistochemistry of WAT (left panel) and BAT (right panel) from C57Bl6J mice using anti-FCoR anti-sera. Scale bars indicate 20 μm.

