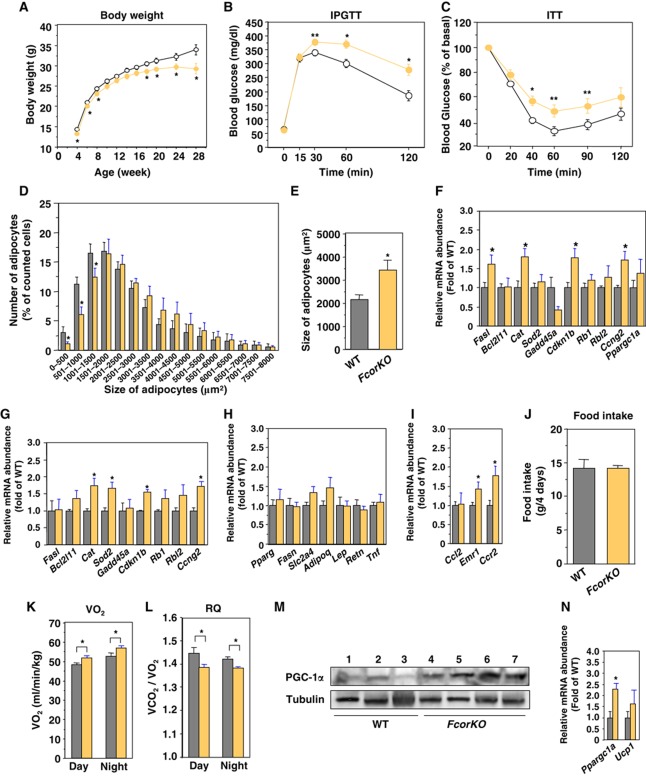
Figure 8.
Deletion of Fcor induces insulin resistance. (A) Body weight of wild-type and FcorKO mice fed a normal chow diet. Data represent the mean values±s.e.m. of 20–30 male mice for each genotype. The open and yellow closed circles indicate wild-type and FcorKO mice, respectively. An asterisk indicates statistically significant difference between wild-type and FcorKO (*P<0.01 by one-way ANOVA). (B) Intraperitoneal glucose tolerance test in wild-type (n=10) and FcorKO mice (n=10) under normal chow diet. The open and yellow closed circles indicate wild-type and FcorKO mice, respectively. Data represent mean values±s.e.m. Asterisks indicate statistically significant differences between wild-type and FcorKO mice (*P<0.001 and **P<0.02 by one-way ANOVA). (C) Intraperitoneal insulin tolerance test in wild-type (n=10) and FcorKO (n=10) fed a normal chow diet. Data represent the mean values±s.e.m. Asterisks indicate statistically significant differences between wild-type and FcorKO mice (*P<0.005 and **P<0.05 by one-way ANOVA). (D) Distribution of adipocyte size. The sizes of single adipocytes from 5-month-old wild-type (grey bar) or FcorKO (yellow bar) mice fed a normal chow diet were measured as described in ‘Supplementary Experimental Procedures’. The data represent the mean values±s.e.m. of the percentage of all adipocytes with the indicated size. Asterisks indicate statistically significant differences between wild-type and FcorKO mice (*P<0.05 by one-way ANOVA). (E) The average of size of adipocytes from (D). An asterisk indicates a statistically significant difference between wild-type and FcorKO mice (*P<0.005 by one-way ANOVA). (F, G) Real-time PCR of Foxo1-target genes using WAT (F) and BAT (G) from wild-type (grey bar) and FcorKO (yellow bar) mice. Data represent the mean±s.e.m. of RNA samples from 10 mice of each genotype. Asterisks indicate statistically significant differences between wild-type and WFCoR transgenic mice (*P<0.05 by one-way ANOVA). (H) Real-time PCR of WAT-specific genes using WAT from wild-type (grey bar) and FcorKO (yellow bar) mice fed a normal chow diet. Data represent the mean values±s.e.m. of RNA samples from five mice of each genotype. (I) Real-time PCR of Ccl2, Emr1, and Ccr2 genes using WAT from wild-type (grey bar) and FcorKO (yellow bar) mice. Data represent the mean values±s.e.m. of RNA samples from five mice of each genotype. Asterisks indicate statistically significant differences between wild-type and FcorKO mice (*P<0.05 by one-way ANOVA). (J) Food intake of 5-month-old wild-type (grey bar) and FcorKO (yellow bar) mice. Data represent the mean values±s.e.m. of food intake for 4 days. (K, L) The effects of deletion of Fcor on energy expenditure. Average oxygen consumption (K) and respiratory quotient (L) of 5-month-old wild-type (grey bar) and FcorKO (yellow bar) mice fed a normal diet. Data represent the mean values±s.e.m. of six male mice for each genotype. Measurements of oxygen consumption were performed for 72 h after allowing the mice to acclimate to the cage environment. An asterisk indicates a statistically significant difference between wild-type and FcorKO mice (*P<0.05 by one-way ANOVA). (M) Western blotting of PGC-1α (top panel) and tubulin (bottom panel) in BAT from wild-type (lanes 1–3) and FcorKO (lanes 4–7) mice. (N) Real-time PCR of Ppargc1a and Ucp1 using BAT from wild-type (grey bar) and FcorKO (yellow bar) mice. Data represent the mean values±s.e.m. of RNA samples from 10 mice of each genotype. Asterisks indicate statistically significant differences between wild-type and WFCoR transgenic mice (*P<0.05 by one-way ANOVA). Figure source data can be found with the Supplementary data.

