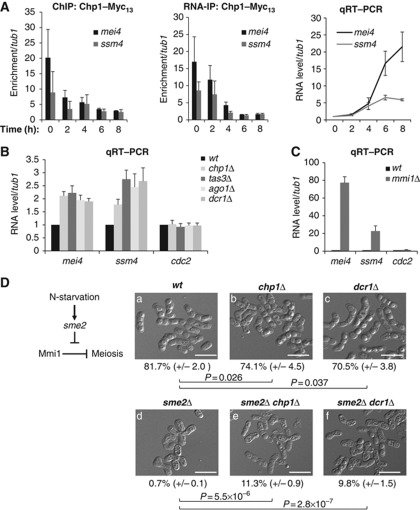
Figure 4.
Effective Mmi1-mediated silencing activity is impaired in RNAi deficient cells. (A) Time course analysis from diploid cells induced to undergo sexual differentiation by nitrogen starvation. ChIP (left panel) and RNA-IP (middle panel) analyses of Chp1-Myc13 association with respectively the chromatin and mRNAs of mei4 and ssm4, relative to tub1. qRT–PCR analysis (right panel) of mei4 and ssm4 RNA levels, relative to tub1 RNA, during the time course analysis. (B) qRT–PCR analysis of mei4, ssm4 and cdc2 RNA levels in chp1Δ, tas3Δ, ago1Δ or dcr1Δ, relative to tub1 RNA and normalized to the wild type. (C) qRT–PCR analysis of mei4, ssm4 and cdc2 RNA levels in mmi1Δ, relative to tub1 RNA and normalized to the respective RNA levels in wild type. All error bars represent s.d. from three independent biological replicates. (D) Diagram depicting the sme2-dependent inhibition of Mmi1 upon sexual differentiation (left panel). Representative images of cells counted after sexual differentiation induction to measure sporulation frequency of the wild type (a), chp1Δ (b), dcr1Δ (c) and sme2Δ (d) single mutants, and sme2Δ chp1Δ (e) and sme2Δ dcr1Δ (f) double mutants (right panel). Sporulation frequency was determined by counting ascospores and the total number of cells under a microscope. An ascospore was counted as the product of two cells. Sporulation frequency expressed in percentage is represented as a mean (±s.d.) calculated from three independent biological replicates. P values were calculated using the Student’s t-test. White scale bars=10 μm. Figure source data can be found with the Supplementary data.

