Figure 6.
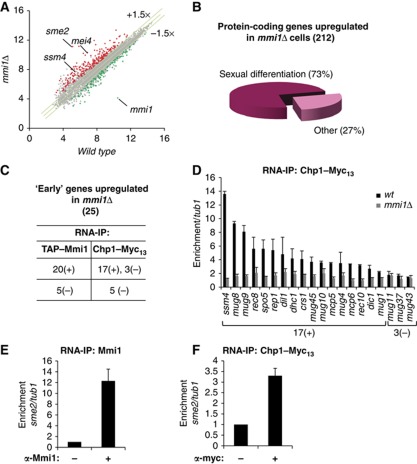
Transcriptome of mmi1Δ cells and large-scale identification of RNAs bound by Mmi1 and Chp1. (A) Scatter plot of S. pombe genome-wide gene expression measured from hybridization signals of RNAs isolated from mmi1Δ cells (Y axis) and from wild type cells (X axis). Red and green dots represent genes up and down regulated, respectively. Grey dots represent genes with no change in their RNA level in mmi1Δ compared to wild type and mei4-828 cells. Each hybridization signal is an average of two independent biological replicates and is plotted using a log2 scale. Note that the mmi1Δ cells used for the transcriptome analysis also contain the mei4-828 mutation (further described in the experimental procedure section). Transcriptome of mei4-828 cells is highly similar to wild type cells as shown in Supplementary Figure 6A. (B) Pie chart representing the distribution of the protein-coding genes upregulated in mmi1Δ cells according to their expression during sexual differentiation (Mata et al, 2002). (C) Table summarizing the RNA-IP analyses of TAP-Mmi1 and Chp1-Myc13 association with 25 mRNAs specific of the ‘early’ phase of sexual differentiation and accumulating in mmi1Δ, relative to tub1 mRNA control. An RNA was considered significantly associated with Mmi1 or Chp1 when enriched at least two fold after RNA-IP. Enriched and non-enriched mRNAs are classified as (+) and (−), respectively. (D) RNA-IP analysis of Chp1-Myc13 association with Mmi1 mRNA targets in wild type or mmi1Δ, relative to tub1. 17(+) and 3(−) denote respectively RNAs that are and are not significantly enriched in Chp1-Myc13 RNA-IP in (D). (E, F) RNA-IP analyses of Mmi1 or Chp1-Myc13 association with sme2 RNA, relative to tub1. Error bars represent s.d. from at least three independent experiments.

