Figure 3.
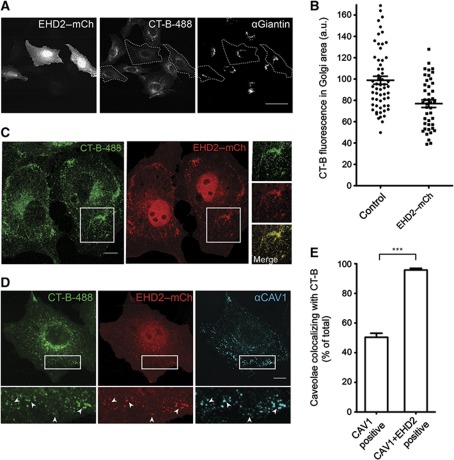
EHD2-positive caveolae confine cholera toxin B to the plasma membrane. (A) CV1 cells expressing EHD2–mCherry were incubated with fluorescent CT-B-488 for 30 min and chased for 30 min. Cells were immunostained with anti-Giantin antibodies and analysed by confocal microscopy; the focus was set to the Golgi apparatus. Marked cells express EHD2–mCherry and show decreased CT-B signal in Golgi area. Scale bar 50 μm. (B) Quantification of the mean CT-B-488 fluorescence in the Golgi region defined by anti-Giantin staining of non-transfected control cells and EHD2–mCherry-transfected cells. Scatter dot plots show all data points and the mean±s.e.m. (C) CV1 cells expressing EHD2–mCherry were incubated with CT-B-488 as in (A). Confocal image with the focus on the plasma membrane is shown; the insets highlight colocalization of CT-B and EHD2 in puncta. Scale bar 10 μm. (D) Cells (as in B) were stained for endogenous CAV1. Arrows in the magnification highlight colocalization of CT-B, EHD2, and CAV1. Scale bar 10 μm. (E) Quantification of caveolae colocalizing with CT-B after 30 min incubation and 30 min chase (as in A). Cells were stained for endogenous CAV1 and imaged with focus on the plasma membrane by confocal microscopy. In non-transfected cells, CAV1-positive spots were analysed. In EHD2-transfected cells, CAV1 and EHD2–mCherry-positive spots were analysed. Ten cells were analysed for each condition. Bars represent mean±s.e.m. Significance was analysed with a two-tailed unpaired t-test. ***P-value<0.0001.

