Figure 4.
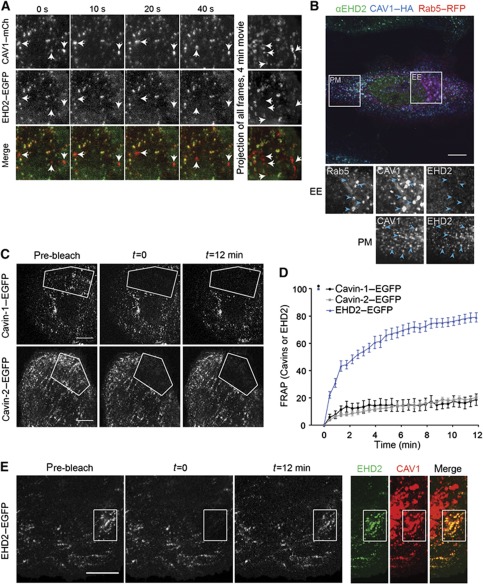
EHD2 is limited to stationary caveolae in the plasma membrane and undergoes dynamic exchange. (A) TIRF images (10 s intervals) of a time-lapse series of a CV1 cell, co-expressing EHD2–EGFP and CAV1–mCherry. Right panel: Maximum intensity projection of all frames of the 4-min movie with a frame rate of 0.5 Hz. Arrows highlight moving caveolae devoid of EHD2. Scale bar 10 μm. (B) Confocal image of a HeLa cell expressing CAV1–HA and Rab5-RFP for 16 h, immunostained for CAV1 and endogenous EHD2. Highlighted areas are enlarged and show EE or PM regions. Arrows point to EE or PM spots. (C) Representative confocal images of FRAP experiments with cavin-1–EGFP or cavin-2–EGFP expressing cells. No fluorescence recovery can be detected during the recorded time. Scale bars 10 μm. (D) FRAP curves of transfected CV1 cells. Relative EGFP intensity of indicated fusion proteins in bleached regions. Intensities before and directly after bleaching (t=0) were set to 100 and 0%, respectively. Images were recorded every 20 s for 12 min. n=10, 9, and 6 for EHD2–EGFP, cavin-1–EGFP, and cavin-2–EGFP, respectively. (E) Representative confocal images of FRAP experiments with EHD2–EGFP expressing cells. EHD2–EGFP signal reappears at initially bleached spots. Right panels: Spots are positive for co-expressed CAV1–mCherry. Scale bar 10 μm.

